

The most popular EV buying advice is also the least useful: buy the biggest battery and the longest advertised range. That shortcut ignores the numbers that decide whether an electric vehicle feels effortless or frustrating after the first fast-charging stop.
A serious electric vehicle comparison should rank sustained real-world range, charging-curve performance, efficiency, thermal management, and total cost of ownership. The unified EV Stats catalog covers 1,374 electric vehicles across 75 brands, but the important lesson isn't the size of the catalog. It's that identical-looking specification sheets can produce very different results on a winter highway, during a long family trip, or across a commercial duty cycle.
| Comparison factor | What to examine | Why it matters |
|---|---|---|
| Real-world range | Independent tested range and conditions | Shows how far the vehicle travels outside a laboratory |
| Charging curve | Average power and 10–80% session time | Reveals how quickly the car completes a useful road-trip stop |
| Efficiency | Energy use per distance | Determines usable range and running cost |
| Thermal management | Battery preconditioning, cooling, and heat-pump equipment | Helps preserve performance across temperature changes |
| Total cost of ownership | Price, energy, maintenance, and depreciation | Shows what the vehicle actually costs to keep |
Table of Contents
- Why Most Electric Vehicle Comparisons Get the Shortlist Wrong
- The Five Criteria That Drive an EV Comparison
- Real-World Range Versus Lab Numbers in 2026
- Charging Architecture and the Charging Curve
- Price, Depreciation, and Total Cost of Ownership
- Matching EVs to Commuters, Families, and Fleets
- Building Your Shortlist With Side-by-Side Comparison Tools
- Frequently Asked Questions From Real EV Buyers
Why Most Electric Vehicle Comparisons Get the Shortlist Wrong
A larger battery gives an EV more stored energy, but it doesn't automatically make the vehicle better. A heavy SUV can carry a large pack and still consume more energy than a lighter, better-engineered car with less capacity. Battery size is an input, not a verdict.
Brochures also hide the failure modes that matter most in daily use. A vehicle may begin a trip with an impressive range estimate, then lose practical distance in cold weather, at motorway speeds, or under sustained thermal load. A high peak charging figure can be equally misleading if the car reaches that rate briefly and then tapers sharply.
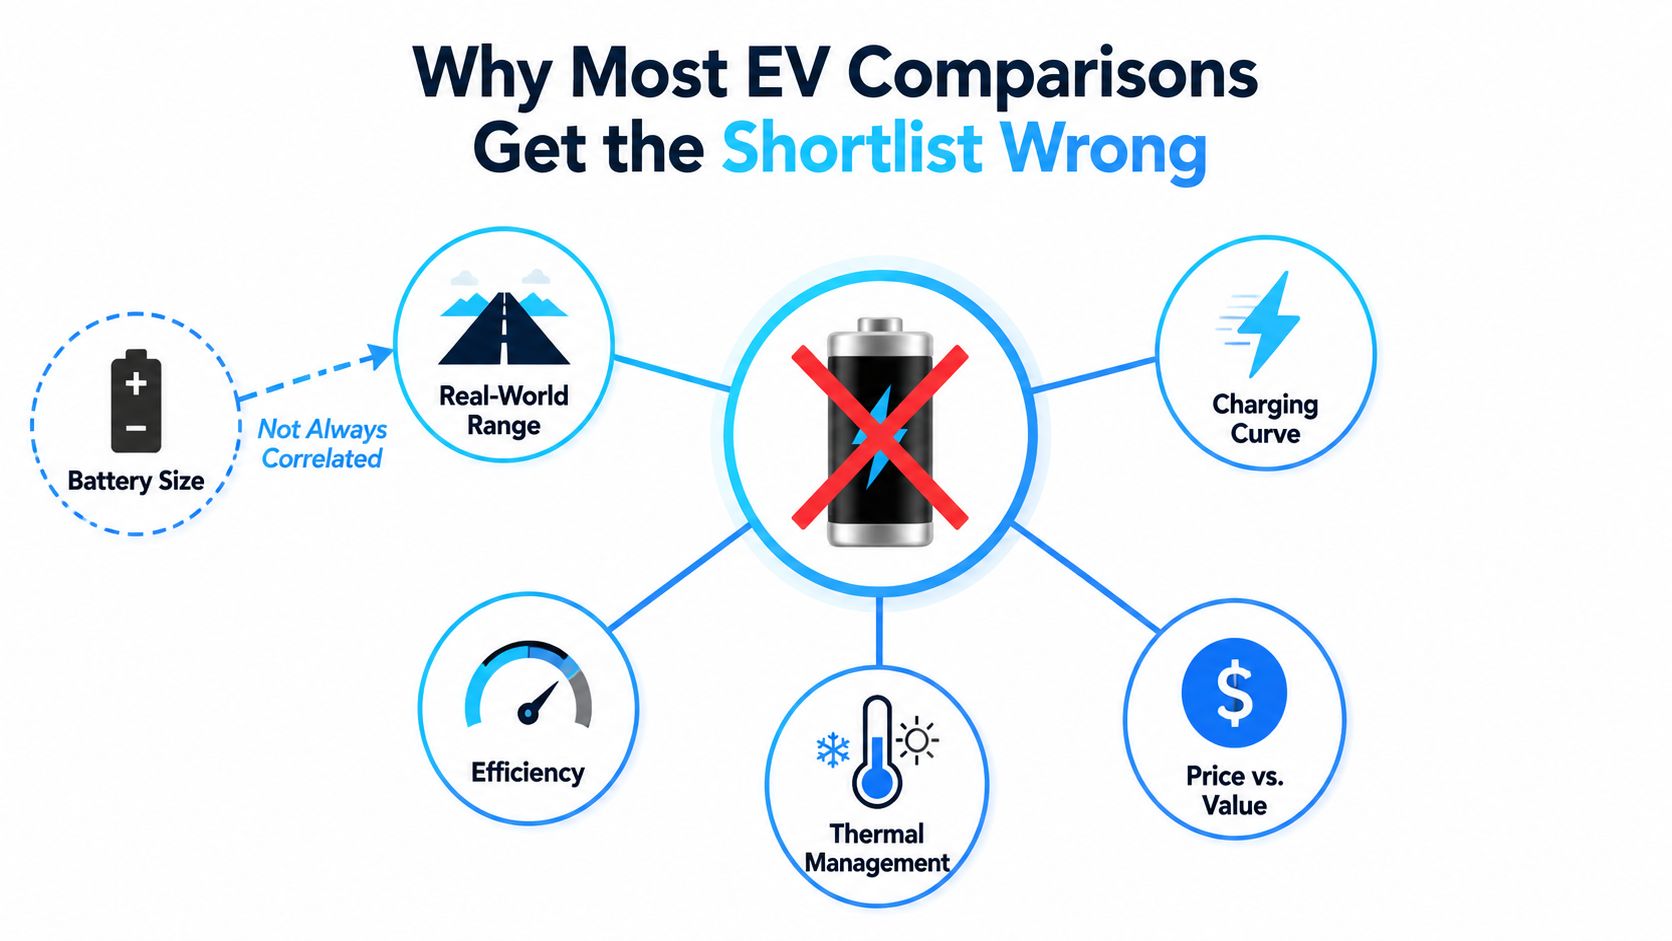
The useful numbers sit below the headline
Official testing still has value. The European WLTP procedure was introduced in 2017 to replace the older NEDC cycle, creating a more realistic basis for comparing range, energy use, and performance across models, as described by the International Energy Agency's explanation of electric-car testing trends. WLTP is useful for relative ranking, but it shouldn't be treated as a promise of motorway range.
A better shortlist asks four questions:
- How far does it travel in the conditions I face?
- How much range does it add during a typical charging stop?
- How efficiently does it use its battery?
- What will it cost after depreciation, energy, maintenance, and insurance?
The difference is practical. A smaller-battery EV with strong efficiency and a flat charging curve can beat a larger-battery rival on a long journey. A premium badge doesn't change that calculation.
Practical rule: Treat manufacturer range and peak charging claims as upper bounds. Build your decision around repeatable performance in your climate, at your normal speed, with your normal load.
The Five Criteria That Drive an EV Comparison
Peak charging power and laboratory range make attractive headlines, but they do not settle a buying decision. Use five filters together, with sustained real-world range, charging curves, and total cost of ownership carrying more weight than isolated maximum figures. This guide applies that method across a unified dataset of 1,374 models.
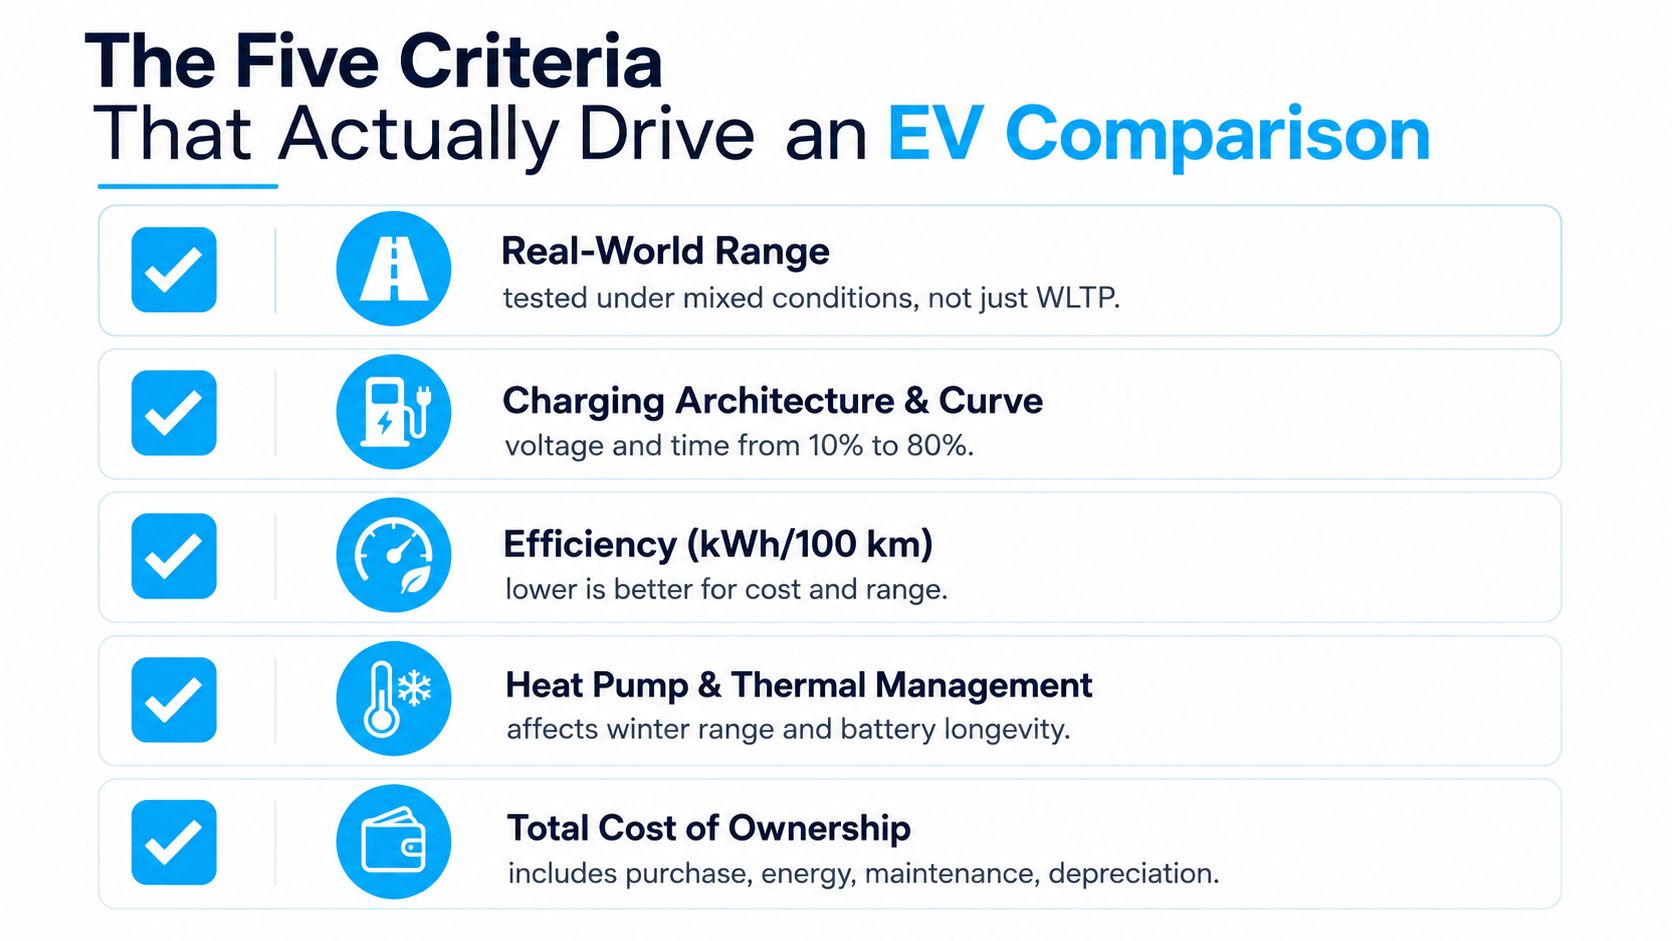
Start with usable range
Independent range evidence should anchor the shortlist. Choose enough range for your regular duty cycle, then keep a practical reserve for weather, traffic, and detours. A vehicle that barely completes an ordinary day creates charging pressure and leaves little room for disruption.
Make the charging curve your road-trip filter
Peak kilowatts describe only one moment. Check the time from 10% to 80%, average power across that window, and repeatability after a long drive. A car that charges rapidly for a few minutes but tapers early may lose its apparent advantage before the battery reaches a useful level.
Compare efficiency, not just capacity
Efficiency, usually expressed in kWh per 100 km, links battery capacity to distance covered. Vehicles with similar range can use energy very differently, affecting charging frequency, home electricity costs, and the battery size required for each journey.
Include thermal management
Battery preconditioning, liquid cooling, heat-pump equipment, and software control determine winter usability and charging consistency. These systems influence whether the battery can accept high power when you reach a charger and whether cabin heating consumes an excessive share of available energy.
Calculate ownership rather than admiring the sticker
Purchase price is only the opening line. Include depreciation, energy, maintenance, insurance, tyres, financing, taxes, and charging equipment. A cheaper EV can deliver poor value if it depreciates quickly or uses substantially more energy than a more efficient alternative.
A dependable shortlist forms when these measures point in the same direction. Range tests the duty cycle, charging exposes road-trip time, efficiency reveals the cost of extra mass, thermal hardware protects seasonal performance, and TCO shows whether the purchase price earns its place.
Real-World Range Versus Lab Numbers in 2026
Laboratory figures are best used for relative comparison, not trip planning. WLTP and EPA procedures create a consistent reference, but they don't reproduce every combination of motorway speed, low temperature, wind, passengers, luggage, heating, and battery temperature.
The June 2026 BEVDB benchmark found combined real-world range estimates averaging 19.5% below official WLTP and EPA ratings overall, with Europe averaging 24.6% below WLTP and the United States averaging 10.5% below EPA, according to the BEVDB real-world range report. That gap is large enough to change a buying decision, especially in European comparisons.
Adjust the figure before you plan a journey
Don't apply one universal correction to every vehicle. Use the tested result as the starting point, then assess climate, speed, terrain, payload, and heating demand. A car that performs well in mild mixed driving may be less convincing during a cold, fast motorway trip.
| Condition | Adjustment approach | Example of 500 km WLTP | When to use |
|---|---|---|---|
| Mixed real-world driving | Use independent tested data | Varies by vehicle and test conditions | Initial shortlist |
| European real-world average | Consider the reported WLTP gap | About 377 km | Conservative European planning |
| U.S. real-world average | Consider the reported EPA gap | About 448 km | Conservative U.S. planning |
| Winter or high-speed travel | Apply a vehicle-specific seasonal reduction | Can be materially lower | Cold-weather road trips |
The example values above are arithmetic illustrations based on the reported regional gaps, not guarantees for any particular model. A car with efficient aerodynamics, strong thermal control, and a useful heat pump may outperform the average, while a large, fast SUV may fall short.
For a model-by-model starting point, use an electric car range comparison that separates official specifications from real-world context. Then check the exact test conditions before treating a result as comparable.
Planning rule: Use WLTP to see how models rank. Use independent range data to estimate stops, and add a personal reserve for weather, speed, and payload.
Charging Architecture and the Charging Curve
Peak charging power is a marketing number. The charging curve is the ownership experience.
A 400V system can charge quickly when the battery is at a favourable state of charge, but many vehicles taper as the pack fills or heats up. Native 800V architecture can reduce current for a given power level, helping the vehicle sustain higher charging rates when the battery, cable, and charger support the system.
The 2026 analysis of U.S.-market EVs found that sub-20-minute 10–80% charging sessions were almost exclusively associated with native 800V vehicles. It also found that many 400V cars remained constrained to roughly 200–270 kW, even when connected to 350 kW hardware, while many native 800V designs sat in an 18–24-minute 10–80% tier, compared with more than 30 minutes for many 400V vehicles, as detailed in the 800V charging analysis.
Compare the whole session
| Architecture | Typical strength | Main limitation | What to verify |
|---|---|---|---|
| 400V | Broad compatibility and mature hardware | Earlier tapering can extend stops | Average 10–80% power |
| 800V | Higher sustained potential and shorter sessions | Needs compatible vehicle and infrastructure | Charger support, preconditioning, and repeatability |
The charging curve reflects more than voltage. Battery chemistry, cell design, state of charge, cooling, software, cable temperature, and charger availability all influence the result. Battery preconditioning is especially important because arriving with a cold pack can prevent the vehicle from accepting its advertised rate.
C-rate offers a useful way to think about the relationship between pack size and charging power. 1C means a theoretical full-pack charge in one hour, so a smaller pack charging at a higher C-rate can replenish energy faster than a larger pack charging at a lower C-rate. The useful comparison remains average power across the 10–80% window, not the first peak displayed on the charger.
Check the practical details too. Charge-port position affects queues and cable reach, Plug&Charge can reduce payment friction, and NACS or CCS compatibility depends on your market and access strategy. A technically fast EV becomes less useful if the chargers on your regular routes don't support its architecture.
For a clear explanation of home and public charging categories, consult this guide to EV charging levels.
Price, Depreciation, and Total Cost of Ownership
An EV comparison that stops at list price is incomplete. Use four core inputs: transaction price, future residual value, energy cost, and scheduled maintenance. Then add insurance, tyres, financing, taxes, and home-charging equipment where they apply.
The correct formula is straightforward:
Total cost per mile = (purchase price minus resale value + energy cost + maintenance + insurance + tyres + charging equipment + taxes) ÷ total miles driven
Use your own figures. Electricity rates vary by location and tariff, annual mileage changes the effect of fixed costs, and depreciation can outweigh energy savings for short ownership periods.
Depreciation can decide the winner
Residual value deserves more attention than another round of acceleration comparisons. A vehicle with low energy use may still be expensive to own if its resale value falls sharply. Conversely, a higher-priced model can make financial sense when it retains value and fits a demanding duty cycle.
Don't use a generic residual assumption for every brand or body style. Check comparable used listings, lease residual information where available, warranty coverage, battery reputation, and the pace of model updates. A major price reduction on a new vehicle can also affect the value of existing stock.
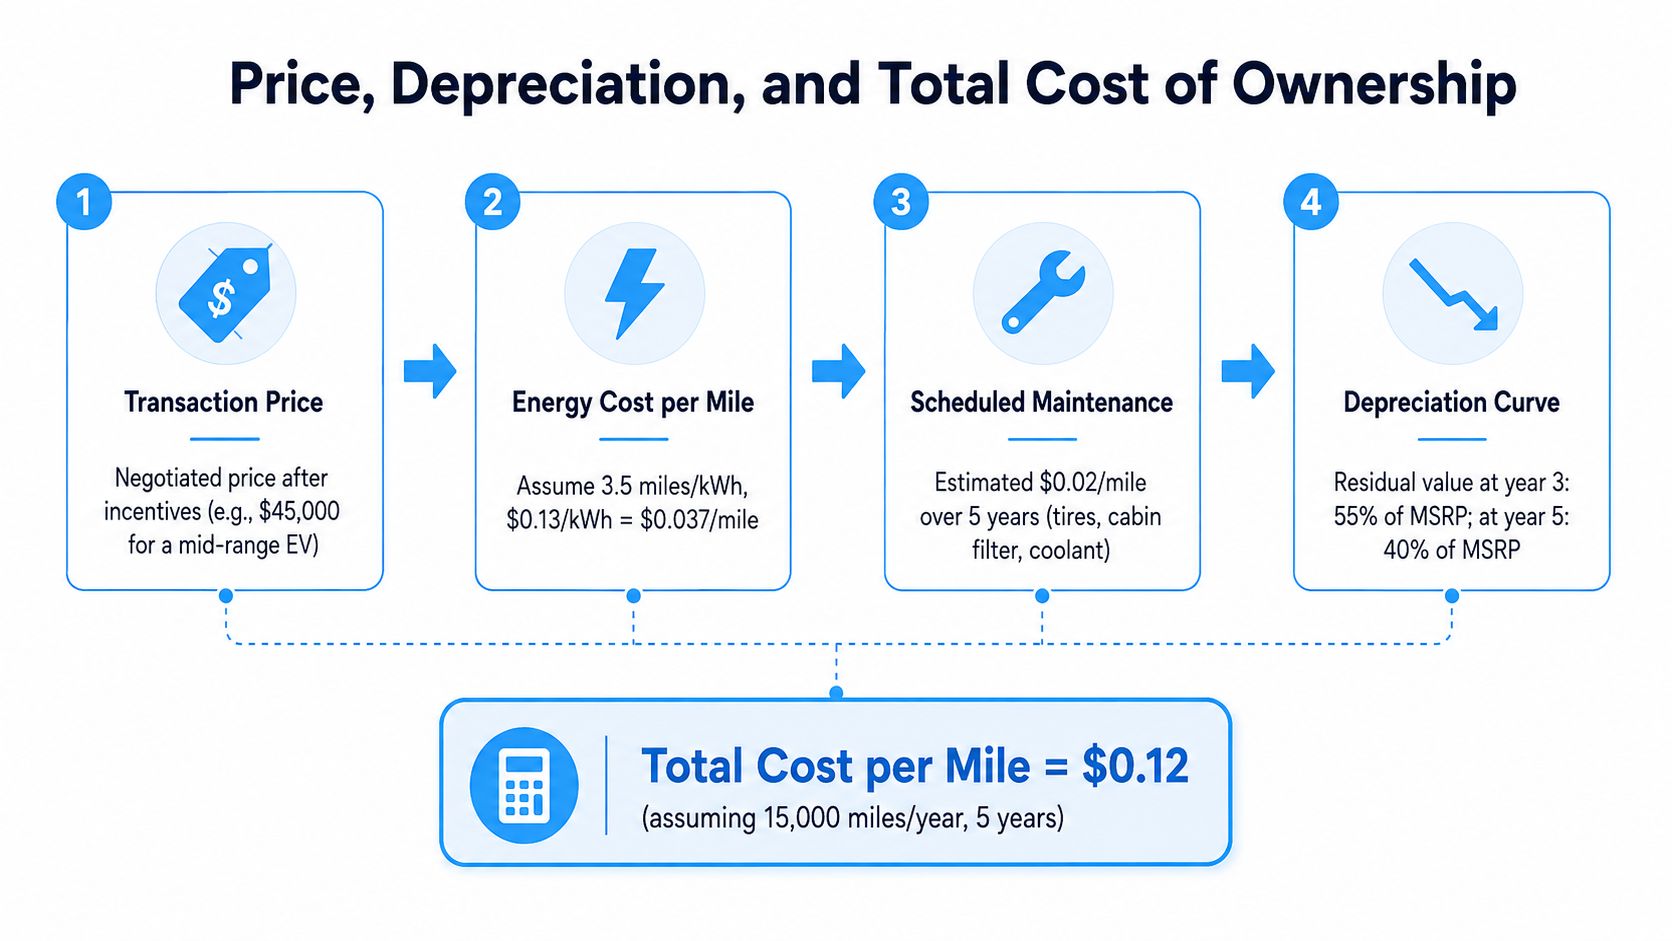
Use a buyer-specific worksheet
- Transaction price: Record the negotiated vehicle price after applicable incentives.
- Energy: Divide your local electricity price by the vehicle's tested miles per kWh.
- Maintenance: Include scheduled servicing, tyres, fluids, inspections, and wear items.
- Depreciation: Estimate the difference between purchase price and likely resale value.
- Fixed ownership costs: Add insurance, financing, registration, taxes, and home charging.
A fleet manager should run several scenarios rather than one optimistic forecast. High utilisation can magnify energy and maintenance savings, but resale risk, downtime, depot upgrades, and service availability can change the result. Individual buyers should also model their actual charging split, because public fast charging often costs more than overnight home charging.
The best EV isn't the one with the lowest sticker price. It's the one that delivers the required work while preserving value and avoiding expensive operational compromises.
Matching EVs to Commuters, Families, and Fleets
The same EV can be excellent for one buyer and wrong for another. A commuter, a family, and a fleet manager don't have different opinions about the same specification. They have different jobs for the vehicle to perform.
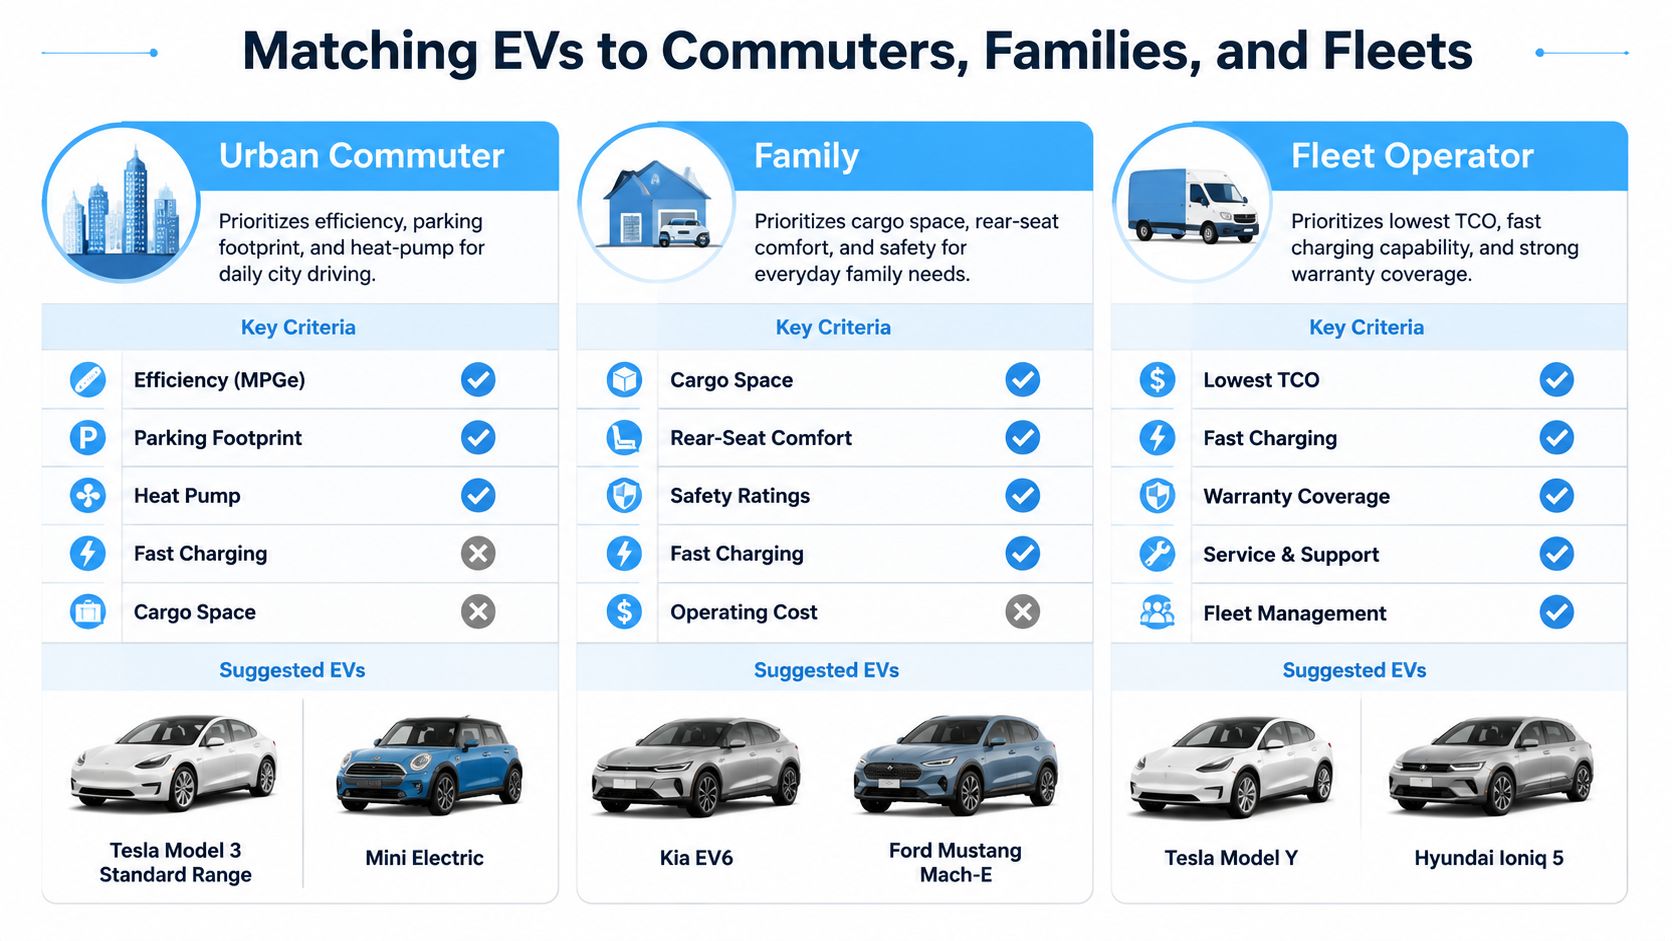
The urban commuter
A city driver should prioritise efficiency, exterior footprint, visibility, parking ease, and reliable cold-weather cabin performance. A compact sedan or hatchback with modest consumption can be a stronger choice than a large SUV with a bigger battery, particularly when home or workplace charging is available.
Prioritise: efficiency, manoeuvrability, heat-pump and thermal performance.
Negotiate on: extreme range and maximum towing ability.
Reject outright: a vehicle that can't be charged conveniently at home, work, or a dependable nearby location.
The family buyer
Families should inspect second-row space, child-seat access, cargo geometry, safety systems, software usability, and road-trip charging. A large battery doesn't compensate for a cramped rear bench or a charging stop that stretches every journey.
Prioritise: seating and cargo practicality, safety and driver assistance maturity, charging-curve performance.
Negotiate on: acceleration and luxury trim features.
Reject outright: a vehicle that fails the family's child-seat, luggage, or regular-trip test.
The fleet operator
Fleet selection begins with the duty cycle. Measure daily distance, stop patterns, payload, depot electricity capacity, driver access, telematics, warranty terms, service coverage, and expected uptime. A fleet can accept a less glamorous vehicle if it returns to base reliably, charges inside the operating window, and has predictable support.
Prioritise: cost per kilometre, uptime and service network, depot charging fit.
Negotiate on: styling and premium cabin materials.
Reject outright: a vehicle whose charging or service requirements conflict with the operating schedule.
A model that wins the commuter shortlist may lose for a family because of cargo space. A family SUV may fail fleet economics because its weight increases energy use and tyre wear. Match the vehicle to the task before comparing trim levels.
Building Your Shortlist With Side-by-Side Comparison Tools
Reading one specification sheet after another creates noise. A structured shortlist works better because it forces every candidate through the same tests.
Start with hard constraints. Set your budget ceiling, annual mileage, access to home or workplace charging, body style, seating requirement, towing need, and the longest regular journey. Remove any model that fails a critical requirement before you spend time comparing screens, acceleration, or premium audio.
Score the candidates by use case
Create a weighted score for the five decision criteria. A long-distance driver should give more weight to real-world range and charging-curve performance. A city commuter may prioritise efficiency, footprint, and purchase cost. A fleet manager should weight cost per kilometre, charging availability, uptime, warranty, and service coverage.
A simple scoring sheet can use a consistent scale, but the scale itself matters less than consistency. Record the source and test conditions for every value. Don't mix a warm-weather independent test for one model with a cold-weather result for another without marking the difference.
Sort by cost per distance
List price often hides the operational winner. Sort candidates by estimated cost per kilometre, then inspect why one vehicle ranks better. Lower energy consumption may offset a higher purchase price, while a low upfront cost may be undermined by poor residual value or slow charging on a high-mileage route.
Use a total cost of ownership calculator for electric cars to test different mileage, electricity, maintenance, and holding-period assumptions. Change one variable at a time so you can see which assumption controls the result.
Finish with three to five candidates, then review their charging curves against your most common trip. Ask how much range each vehicle adds during the stop you expect to make, not how impressive its peak figure looks in a brochure. The final test should be physical: sit in the rear seats, load the luggage, connect the cable, and confirm that the vehicle fits your daily routine.
Frequently Asked Questions From Real EV Buyers
How much range disappears in cold weather?
Cold weather can reduce practical range because the battery operates less efficiently and the cabin requires additional heat. Battery preconditioning, thermal management, and a heat pump can reduce the penalty, but the effect varies by vehicle, temperature, speed, wind, tyres, and heating use. Plan with a reserve rather than assuming the official figure will remain available.
Is home charging enough for a commuter?
For many commuters, overnight AC charging is the simplest operating pattern. DC fast charging is primarily a road-trip tool, while home charging restores energy gradually and avoids making every journey depend on public infrastructure. The decisive question is whether your parking location gives you dependable access to a suitable electrical connection.
Which EVs hold their value best?
No universal badge guarantees strong resale. Vehicles with credible battery warranties, efficient powertrains, useful charging performance, broad service support, and sensible ownership costs are better positioned than models that rely only on novelty or premium branding. Check current used-market evidence before assuming a residual value.
Do EV tyres wear faster?
Instant torque, vehicle weight, tyre compound, alignment, driving style, and road surface all affect tyre life. Smooth acceleration and correct pressures matter more than blaming the powertrain. Include replacement tyres in your TCO calculation, especially for heavy or high-performance models.
Which charging cable or adapter do I need?
Confirm the connector standard used by the vehicle and the public network in your region. For international travel, check whether an adapter is approved, whether it supports the required AC or DC function, and whether the vehicle's software and payment system work on the destination network. Port compatibility is only one part of a successful charging plan.
The strongest purchase decision comes from matching tested performance to your own routes, climate, charging access, and ownership horizon. Don't let one impressive specification overrule the complete operating picture.
EV Stats gives you a structured database of 1,374 electric vehicles, side-by-side model comparisons, real-world range context, charging analysis, rankings, a TCO calculator, and a charging simulator. Visit EV Stats to build a shortlist based on sustained range, charging performance, efficiency, and ownership cost before you request a test drive.