

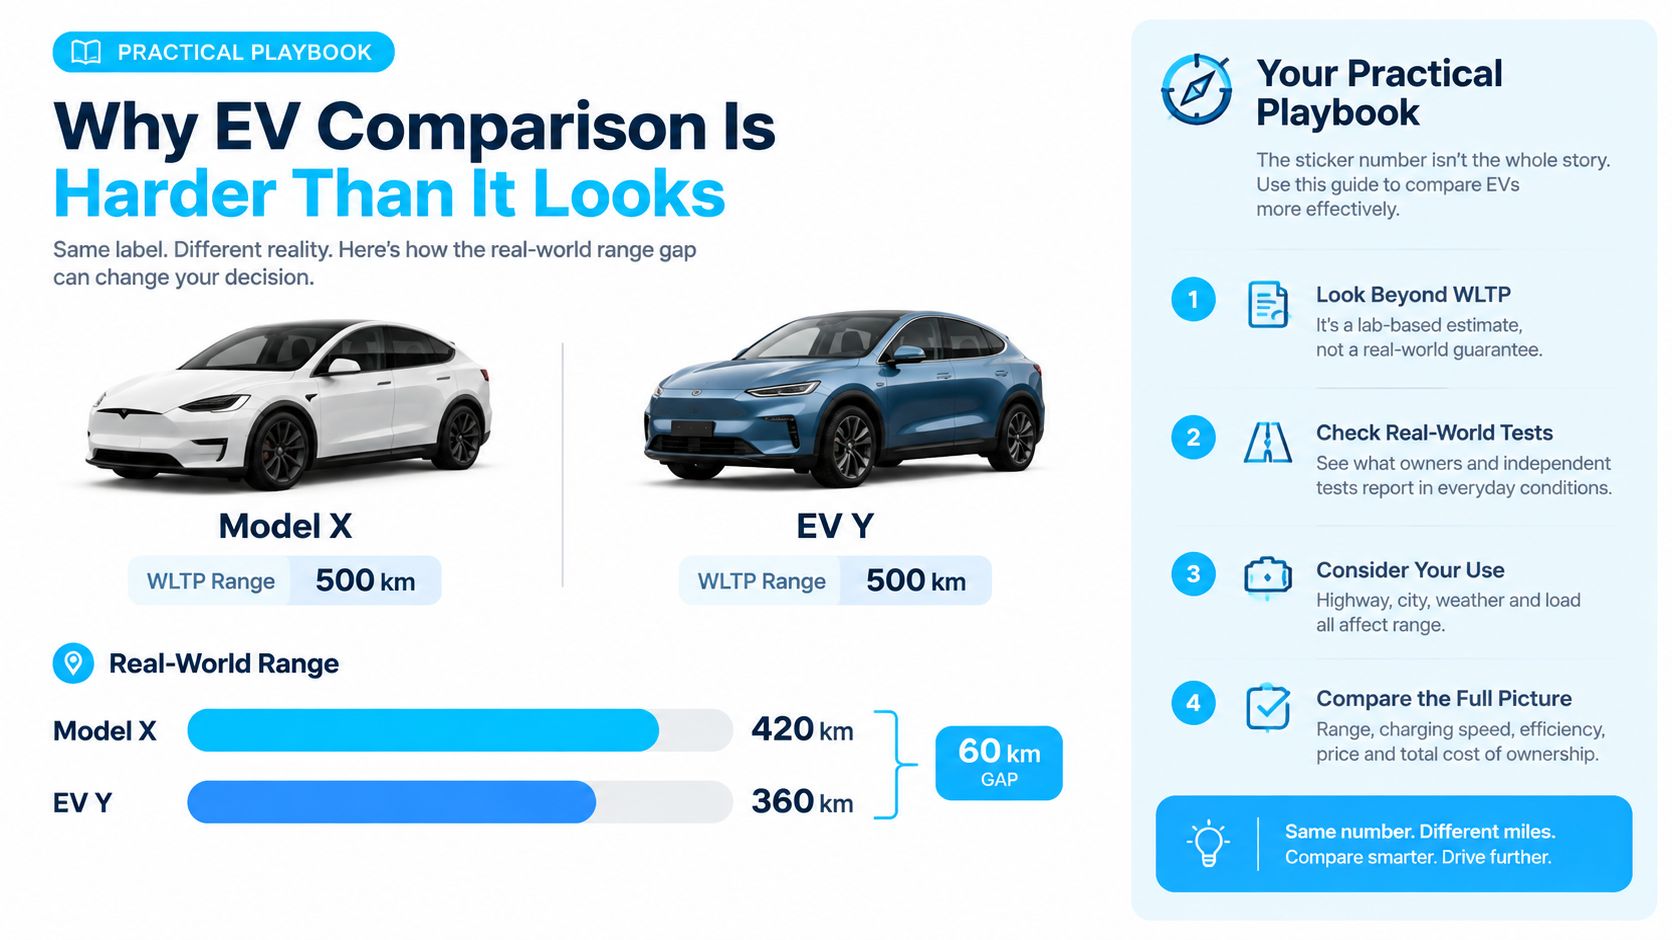
A certified range figure can hide a serious shopping mistake. The 2026 State of Real-World EV Range report puts average estimated range at 19.5% below official WLTP and EPA values overall, with the gap averaging 24.6% below WLTP in Europe and 10.5% below EPA in the United States. At sustained highway speeds, another independent benchmark found that many EVs deliver roughly 75% to 82% of WLTP range.
That's why an EV comparison tool should never be treated as a prettier spec sheet. Used properly, it helps you separate laboratory range from practical range, peak charging from useful charging, and purchase price from ownership cost. Used lazily, it ranks misleading headline numbers.
Table of Contents
- Why EV Comparison Is Harder Than It Looks
- What an EV Comparison Tool Actually Does
- The Five Metrics That Matter Most
- Running a Side-by-Side Comparison Step by Step
- Matching Metrics to Real Use Cases
- Hidden Traps in Headline Specs
- Shortlist Checklist and Final Recommendations
Why EV Comparison Is Harder Than It Looks
Two EVs can carry the same official range rating and perform very differently on a motorway, in freezing weather, or during a long charging stop. Official figures are useful for standardized comparison, but they're not a promise about your commute. The independent real-world range benchmark shows why buyers need a second layer of interpretation alongside WLTP or EPA data.
Start with the test cycle
WLTP, EPA, NEDC, and CLTC are different certification systems. They don't measure vehicles under identical conditions, so a raw range number from one market shouldn't be placed beside another without normalization. The OpenEV Data dataset architecture includes all four rating systems, along with real-world estimates, charging power, charging curves, efficiency, pricing, and market availability.
That matters because manufacturers also vary the way they publish trim details. A model may have several battery sizes, wheel options, drivetrains, or software versions. Dealer listings can lag behind model refreshes, while a brochure may describe a range that applies only to a particular configuration.
Treat charging as a curve, not a headline
Charging standards add another layer of confusion. CCS, NACS, and CHAdeMO describe connection systems, but the connector alone doesn't tell you how quickly the car will charge on a real trip. Battery temperature, state of charge, charger capability, and the vehicle's charging software all affect the result.
An EV database earns its place in your research process by normalizing those inputs. It lets you compare vehicles on a consistent basis before you spend time visiting dealers or arranging test drives.
Practical rule: Use official figures to establish the comparison baseline, then use independent range and charging data to decide whether the car fits your actual routes.
What an EV Comparison Tool Actually Does
An EV comparison tool collects specifications from multiple sources and puts them into a common structure. Instead of opening separate manufacturer pages for battery capacity, charging, dimensions, performance, and price, you can inspect those fields side by side.
The important work happens before the comparison screen appears.
It normalizes incompatible data
A useful platform keeps WLTP, EPA, NEDC, and CLTC figures distinct rather than blending them into one unexplained score. It can also place those official values beside estimated real-world range, so you can see whether a vehicle's certification result is likely to translate well to daily driving.
The EV Stats electric vehicle comparison guide illustrates the broader role of comparison platforms. They turn scattered manufacturer specifications and independent test results into a structured research layer, which is more useful than manually reconciling inconsistent brochures.
It adds the measurements brochures leave out
A serious tool should enrich basic specifications with:
- Charging curves: Average power across a charging session, not only the maximum advertised rate.
- Efficiency: Energy consumption in kWh per 100 km or miles per kWh.
- Usable battery: The energy available for driving, which may differ from gross battery capacity.
- Market pricing: Regional currency and trim context.
- Ownership estimates: Electricity, maintenance, insurance, depreciation, and other assumptions where data is available.
- Scenario filters: Options for commuting, family transport, road trips, or fleet operations.
The OpenEV Data specification shows how broad a modern EV dataset can be. It includes rated and real-world range, AC and DC charging power, charging curves, powertrain, performance, pricing, and market availability.
It structures judgment, it doesn't replace it
No database knows your parking space, winter climate, electricity tariff, or tolerance for charging stops. The tool's job is to make trade-offs visible. Your job is to decide which trade-offs matter.
That distinction prevents a common mistake: accepting a generic ranking as a personal recommendation. A high-range EV may be poor value for a driver who charges at home and rarely takes long trips. A compact, efficient model may be a much better fit even if its brochure range looks less impressive.
The Five Metrics That Matter Most
The five metrics below form the foundation of a useful EV comparison. They shouldn't receive equal weight for every buyer, but they should all be visible before you commit to a shortlist.
| Metric | Data Source | Normalization | Decision Weight |
|---|---|---|---|
| Range | Certification data and independent testing | Keep WLTP, EPA, and real-world estimates separate | High for road trips, moderate for commuting |
| Charging | Manufacturer data and charging-curve tests | Compare sustained power and useful charging time | Very high for long-distance use |
| Efficiency | Vehicle consumption data and independent estimates | Use kWh/100 km or Wh/km consistently | High for daily driving and fleets |
| Dimensions | Manufacturer specifications | Compare length, width, wheelbase, weight, and cargo space | High for families and urban drivers |
| Total cost of ownership | Price, energy, maintenance, insurance, and resale assumptions | Model a consistent ownership period and usage pattern | High for value-focused buyers and fleets |
Range is a planning figure
Start with the certification number, but don't finish there. WLTP is the relevant reference for many European comparisons, while EPA is the more useful baseline in the United States. Neither should be mistaken for a guaranteed motorway result.
Usable battery capacity matters more than gross capacity. Two vehicles can advertise similar battery sizes while delivering different range because of efficiency, thermal management, drivetrain losses, software buffers, and the amount of energy the manufacturer makes available to the driver.
For a long-distance buyer, compare real-world range at highway speeds and in cold conditions. A large battery isn't automatically the better choice if the vehicle consumes more energy to carry it.
Charging is about time saved
Peak DC power is a ceiling, not a trip result. A vehicle may briefly reach its advertised maximum and then reduce power as the battery fills or temperature changes. Compare the average power between 10% and 80% state of charge, the time required for that session, and the distance added.
The EV Charge Curve comparison data demonstrates the difference. In a 2024 technical comparison, 800V models such as the Hyundai Ioniq 5 and Kia EV6 averaged about 185 kW from 10% to 80% and added roughly 175 miles in 15 minutes. The Porsche Taycan Plus averaged about 220 kW and added about 185 miles, while the Tesla Model 3 Long Range averaged about 115 kW and added about 165 miles.
That's a better basis for trip planning than ranking cars by peak kW.
Efficiency affects every journey
Efficiency tells you how much electricity the vehicle needs to travel a given distance. Compare it using one consistent unit, such as kWh per 100 km or Wh/km. Lower consumption generally supports more usable range from the same battery and reduces charging energy for a given trip.
Wheel size, temperature, speed, body shape, drivetrain, and heating demand all influence actual consumption. The EV efficiency measurement guide is useful when you need to interpret those figures rather than treating them as interchangeable labels.
Dimensions determine daily livability
Range gets attention because it sounds important. Dimensions determine whether you enjoy owning the car.
Check exterior length and width for parking, wheelbase for rear-seat space, kerb weight for efficiency, and cargo volume with the seats in their normal position. Families should also check loading height, rear-seat access, towing capability, and child-seat mounting points. A vehicle that fits your routes but not your garage isn't a successful comparison.
TCO beats the sticker price
Total cost of ownership combines the purchase price with energy, maintenance, insurance, depreciation, and other ownership assumptions. The calculation is only as useful as its inputs, so check whether the tool has modeled your annual mileage, charging mix, local energy costs, and expected ownership period.
Weight the five metrics according to your use. A commuter should emphasize efficiency and charging convenience. A road-trip driver should emphasize real-world range and sustained DC charging. A fleet manager should give TCO, uptime, warranty coverage, and energy cost much more weight than acceleration.
Running a Side-by-Side Comparison Step by Step
Start with the vehicle segment, not the entire market. Choose compact hatchbacks, family SUVs, executive saloons, or vans first. Comparing unrelated body types creates noise and encourages you to chase the highest score rather than the right vehicle.
Add two to four candidates to the comparison tray. Four is enough to expose meaningful trade-offs without turning the table into a spreadsheet you won't read. The EV Stats comparison tool is designed for this kind of side-by-side review.
Set priorities before viewing the winner
Decide what your car must do. Write down your daily distance, longest regular journey, home-charging situation, parking limits, passenger needs, and ownership horizon. Then assign practical priority to range, DC charging, efficiency, cargo space, and TCO.
Don't let the platform's default ordering make that decision for you. A generic score can't know whether you spend most of your time in city traffic or on motorways.
Read the table from battery to body
Check the battery section first. Confirm gross and usable capacity, drivetrain, battery chemistry if available, and the certification cycles attached to each range figure. A single number without its test standard isn't enough.
Then inspect charging:
- DC power: Look for peak and sustained performance.
- Charging window: Compare the time from 10% to 80%.
- AC charging: Check the onboard charger rating for home and destination charging.
- Trip usefulness: Consider how much range a realistic stop adds.
Move next to performance and packaging. Acceleration can be useful when joining a motorway, but it's rarely more important than efficiency or charging for ownership. Length, wheelbase, kerb weight, cargo capacity, and turning requirements reveal whether the car works in your daily environment.
Use deltas to expose trade-offs
The most useful comparison cells show what one vehicle gains and loses. One candidate may charge faster but consume more energy. Another may offer better efficiency and lower TCO but require more frequent highway stops. A third may be the most spacious while carrying a weight penalty.
Save the shortlist and export the comparison for dealer conversations. Ask the salesperson to confirm the exact trim, battery, wheel, and charger configuration. If the dealer's answer conflicts with the structured data, investigate the discrepancy instead of assuming either source is correct.
| Spec | Vehicle A | Vehicle B | Vehicle C | Vehicle D |
|---|---|---|---|---|
| Usable battery | Compare | Compare | Compare | Compare |
| Real-world range | Compare | Compare | Compare | Compare |
| Average DC charging | Compare | Compare | Compare | Compare |
| Efficiency | Compare | Compare | Compare | Compare |
| Five-year TCO | Compare | Compare | Compare | Compare |
Matching Metrics to Real Use Cases
The same database can produce four different winners because the buyer's routine changes the weighting.
City commuter
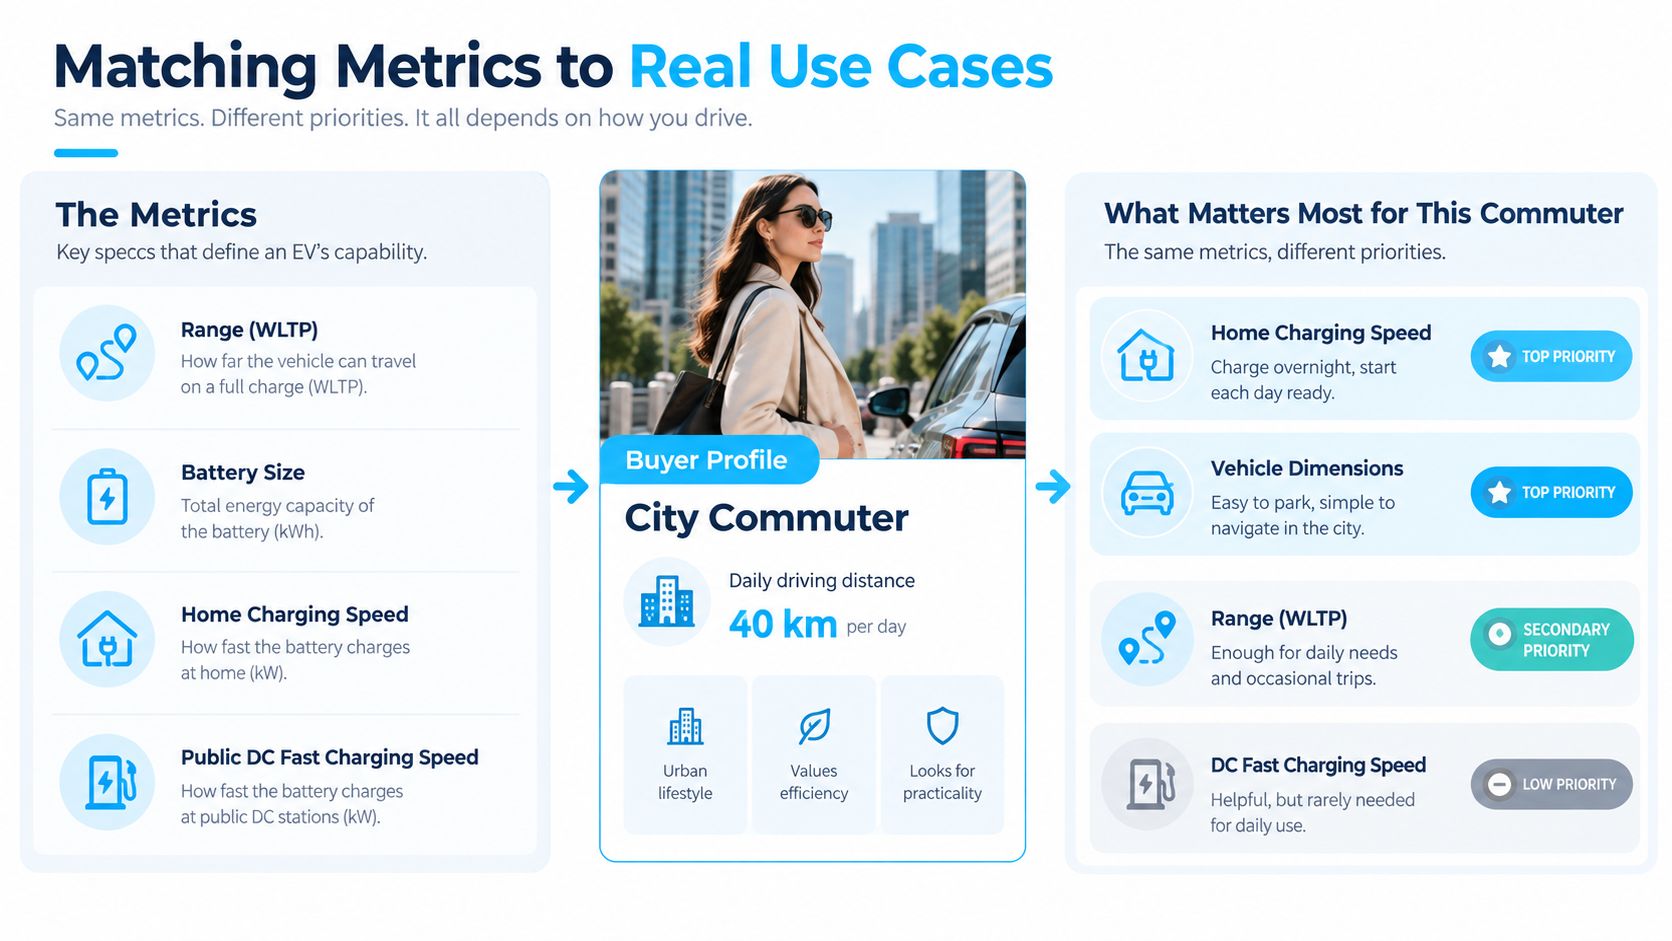
A city driver covering 40 km per day doesn't need to pay for a huge battery solely for reassurance. Prioritize efficiency, compact dimensions, AC charging, visibility, turning space, and ownership cost. Range above 300 km WLTP is generally enough for this profile, but the exact shortlist still depends on weather, parking, and access to home charging.
The three strongest candidates on your platform should be the ones that meet those constraints, not necessarily the models with the longest published range. DC charging belongs lower on the list if public fast charging is rare in your routine.
Family hauler
Families should inspect the whole vehicle, not just its range tile. Compare boot volume with seats in use, rear-seat width, loading height, ISOFIX locations, exterior footprint, towing capability, and heating efficiency alongside range and charging.
A larger SUV can offer useful space but may consume more energy. A well-packaged crossover can carry the same people and luggage with less bulk. The shortlist should contain the three models that fit your family equipment without forcing you into unnecessary battery size.
Long-distance driver
Road-trip buyers should reverse the commuter priorities. Sustained DC charging between 10% and 80%, reliable route planning, highway energy use, and usable motorway range dominate the decision. Peak kW is only a supporting figure.
Public charging access, reliability, wait time, and cost remain important adoption barriers, according to the McKinsey consumer perspective on the EV transition. Compare how often you'll need to stop and how long each stop will last, not just the vehicle's maximum charging rate.
Use this video as a practical supplement when evaluating charging behavior and trip planning.
Fleet buyer
Fleet decisions need a different definition of value. Compare energy cost per kilometer, scheduled maintenance, warranty terms, residual value, utilization, charging logistics, and five-year TCO. A vehicle that looks expensive at purchase can still fit the operation better if it reduces downtime or energy demand.
The final three should satisfy the route profile and financial model. Don't let a consumer-facing range leaderboard decide a procurement decision.
Hidden Traps in Headline Specs
Headline range is the first trap. WLTP provides a standardized baseline, but the real-world range report shows that average estimated results sit below official figures, especially in Europe. Highway speed, cold weather, heating, rain, payload, and wheel choice all move the result.
Use independent real-world estimates as a planning layer. If a tool shows only one range number, it isn't giving you enough information for a serious road-trip decision.
The second trap is peak DC power. A maximum figure may appear for a short portion of the session, then fall as state of charge rises. Compare the charging curve and the average between 10% and 80%. The technical comparison cited earlier shows why a lower peak figure can still deliver competitive trip usefulness when the vehicle sustains power effectively.
Charging judgment: Ask how many kilometers or miles the car adds during a normal stop, not what number appears at the top of the charging specification.
The third trap is purchase price. A cheaper EV can cost more over the ownership period if it depreciates faster, consumes more electricity, carries higher insurance costs, or needs a different charging setup. Read the TCO calculation and inspect its assumptions.
Winter deserves its own check. Cold-weather datasets show model-dependent performance, with some vehicles retaining close to 90% of real-world range in freezing conditions while others lose substantially more, according to the verified cold-weather findings summarized in the real-world range research. Don't use a single brochure figure to compare cars for Northern Europe, Canada, or cold U.S. regions.
Shortlist Checklist and Final Recommendations
Use this checklist before you book a test drive:
- Range: Set a real-world range requirement based on your longest routine journey, weather, and driving speed. Treat WLTP or EPA as the baseline, not the final answer.
- Charging: Confirm home-charging compatibility, AC charging time, and sustained DC performance. Ask whether the charging curve suits your regular stops.
- TCO: Model energy, maintenance, insurance, depreciation, incentives, and financing assumptions across your planned ownership period.
- Dimensions: Verify garage, parking, boot, rear-seat, turning, towing, and child-seat requirements using the exact trim.
- Warranty: Read battery, vehicle, and roadside-assistance terms separately. Check coverage conditions rather than relying on a single warranty headline.
Three mistakes repeatedly weaken EV shortlists. Buyers overvalue peak charging power, ignore cold-weather performance, and skip TCO because the purchase price is easier to find. Avoid all three.
Filter the market first. Compare three to five suitable models, inspect the table column by column, test-drive the top two, and recalculate ownership cost with your actual mileage and charging mix. Choose the vehicle that fits your routine, not the one with the loudest specification.
EV Stats offers an independent EV database with structured specifications, range context, efficiency, charging data, side-by-side comparisons, rankings, ownership-cost estimates, and charging simulations. Use EV Stats to filter your market, compare a focused shortlist, and test the numbers before you speak with a dealer.