

What does an electric car's advertised range mean when you're driving at highway speed, carrying passengers, and heating the cabin on a freezing morning? That question matters more than the largest number on a specification sheet. Electric car specifications only become useful when you connect range, battery capacity, efficiency, charging power, temperature, speed, and route conditions.
A senior buyer shouldn't compare EVs by brochure range alone. The better approach is to ask how much energy the vehicle uses on the journeys you make, how quickly it can recover that energy, and whether the available charging network fits your routine. The figures below provide a framework for making that comparison without confusing laboratory consistency with road-going certainty.
Table of Contents
- Why One Range Number Is Never Enough
- Core Categories of Electric Car Specifications
- WLTP vs EPA vs Real-World Range Explained
- Battery Capacity and Energy Efficiency Metrics
- Powertrain Specifications and Performance Data
- AC and DC Charging Specifications Decoded
- How to Normalize Specifications Across Models
- What Buyers Should Compare Before Deciding
- Quick Reference Guide to EV Specification Terms
- Tools and Resources for Independent EV Research
Why One Range Number Is Never Enough
A single range figure looks precise, but it answers a narrow question. It describes performance under a defined test procedure, not necessarily the distance you'll cover on a winter motorway with a full load and a headwind. Temperature, speed, terrain, traffic, payload, tyre choice, and cabin heating can all change energy consumption.
The testing standard matters too. The U.S. EPA protocol drives a fully charged vehicle through city and highway cycles until depletion, then applies real-world adjustment factors. The EPA says the most common approach uses a 0.7 adjustment factor across test parameters, which helps explain why EPA figures are generally more conservative than laboratory results. The EPA test description and adjustment approach gives buyers useful context, but it still can't predict every route.
Range is a system, not a headline
The IEA reports that the average range for new battery electric vehicles rose from about 200 km in 2015 to about 350 km in 2020, then reached nearly 380 km by 2026. Across 2015 to 2023, the sales-weighted average range grew by nearly 75%, reflecting larger batteries and more efficient vehicles. The IEA EV outlook data also shows a wide segment gap, with small cars averaging around 150 km in 2023, while large higher-end models were already around 360 to 380 km.
Those figures don't mean every EV delivers the same usable distance. A compact city car with a smaller battery may be efficient in urban driving but poorly suited to long motorway journeys. A larger model may offer more reserve at speed, yet consume more energy because of weight, tyres, and frontal area.
Practical rule: Treat advertised range as a standardized reference point. Treat your own highway and winter scenario as the buying specification.
A useful comparison therefore starts with three questions: How far does the car travel in my conditions? How much energy does it consume? How long does it take to recharge on my routes? The answer is rarely found in one field on a manufacturer's page.
Core Categories of Electric Car Specifications
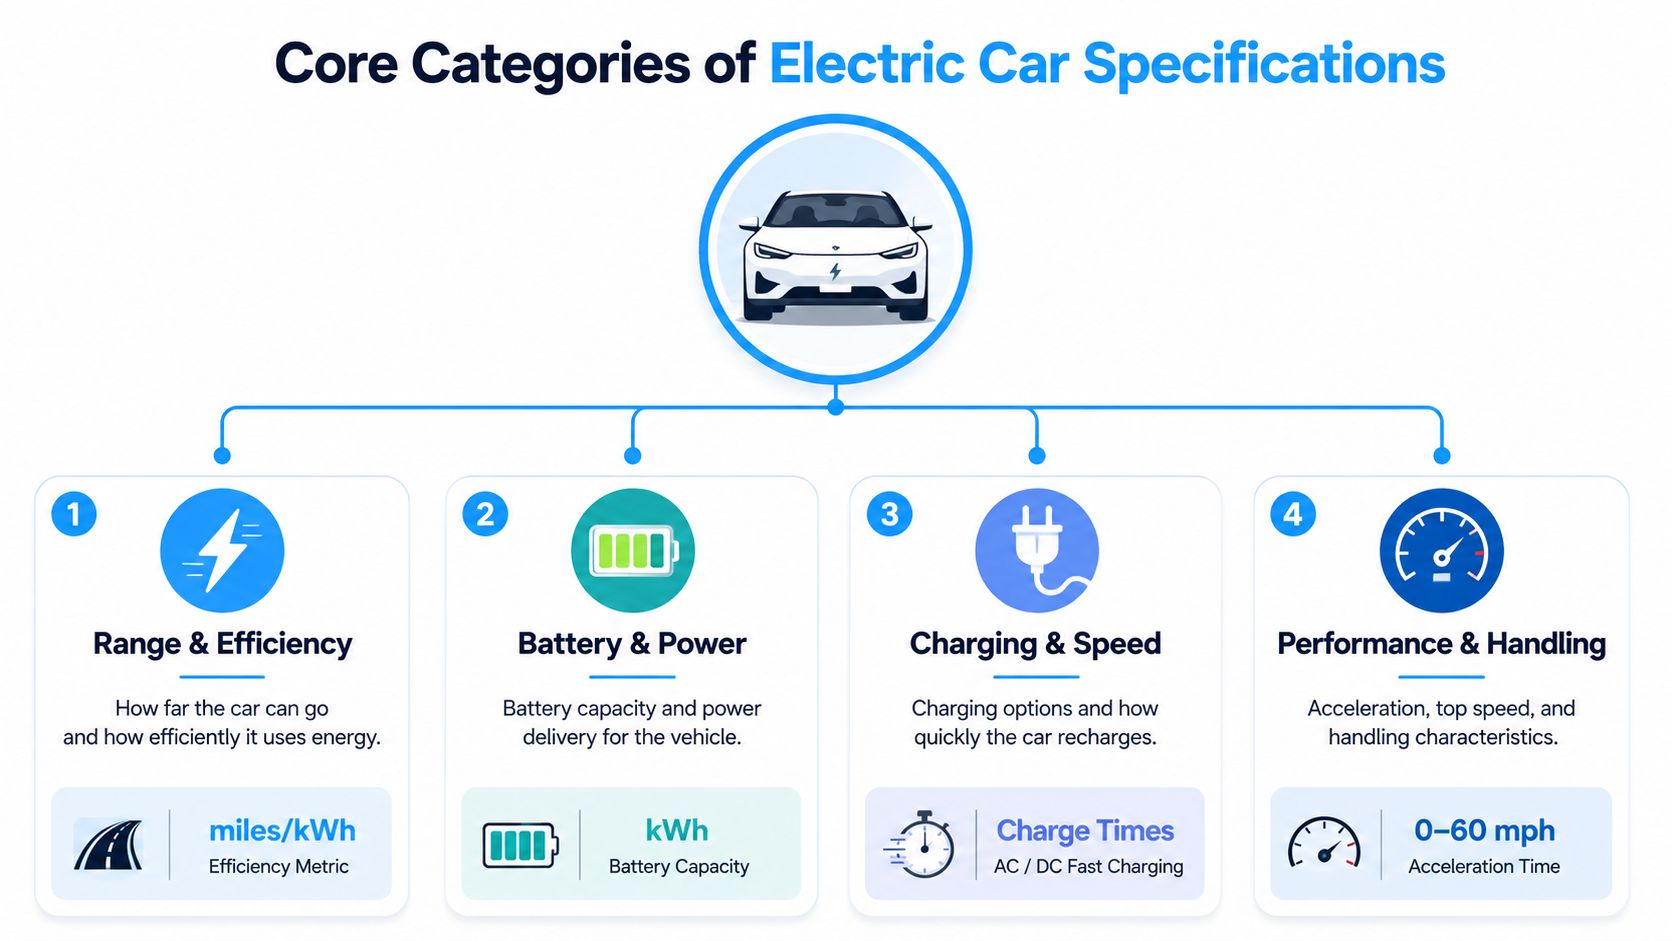
What does an EV specification sheet reveal about a winter highway trip? Range is only the visible result. Battery capacity, efficiency, powertrain output, charging limits, thermal management, and body design determine how much of that range remains useful at speed and in cold weather.
Range and efficiency
Range provides a standardized reference, not a complete trip forecast. Efficiency, usually shown in Wh/km or Wh/mi, indicates how much energy the vehicle consumes. Two EVs with similar battery capacity can cover different distances because one requires less energy at highway speed.
For a meaningful comparison, match the specification to the journey. Motorway speed, cold air, cabin heating, wind, wet roads, passengers, and luggage can all increase consumption. A smaller city-focused EV may use energy efficiently in urban traffic but lose that advantage on a fast route.
Battery and power
Battery capacity is measured in kilowatt-hours, or kWh. Specifications may show gross capacity, which describes the whole pack, or usable capacity, which reflects the energy available to the driver. A protected reserve means those figures are not interchangeable.
Pack size also affects mass, space, thermal control, and charging behaviour. A larger battery can provide more highway reserve, but its additional weight may raise consumption. Read capacity beside efficiency and expected trip conditions rather than treating kWh as a standalone value.
Charging and speed
AC charging generally suits home and destination charging. DC fast charging supports longer journeys. A peak charging figure describes the highest possible intake under suitable conditions, not the time required for a complete session.
The charging curve matters more than peak kW alone. Battery temperature, starting state of charge, station output, and the vehicle's software determine how long high power lasts. Winter preconditioning and route timing can therefore matter as much as the headline maximum.
Performance and practicality
Powertrain specifications cover motor output, torque, drivetrain layout, acceleration, towing capacity, and regenerative braking. Physical data covers luggage space, seating, ground clearance, turning circle, and payload. These fields explain whether an EV can perform the intended work, not merely how quickly it accelerates.
Priorities change with use:
- Daily commuting: efficiency, usable battery capacity, AC charging, and cabin comfort.
- Highway travel: consumption at speed, DC charging behaviour, cold-weather resilience, and route coverage.
- Fleet use: payload, uptime, charging schedules, serviceability, and total cost.
- Family practicality: rear-seat room, luggage volume, charging access, and winter range.
A sound comparison connects four questions: how much energy the trip requires, how much of the battery is usable, how quickly the car can recharge, and whether charging is available along the route. That approach exposes the gap between brochure specifications and practical highway performance.
WLTP vs EPA vs Real-World Range Explained
Which range figure answers the journey you drive? WLTP and EPA results provide repeatable comparison points, but they measure different procedures and cannot predict every trip.
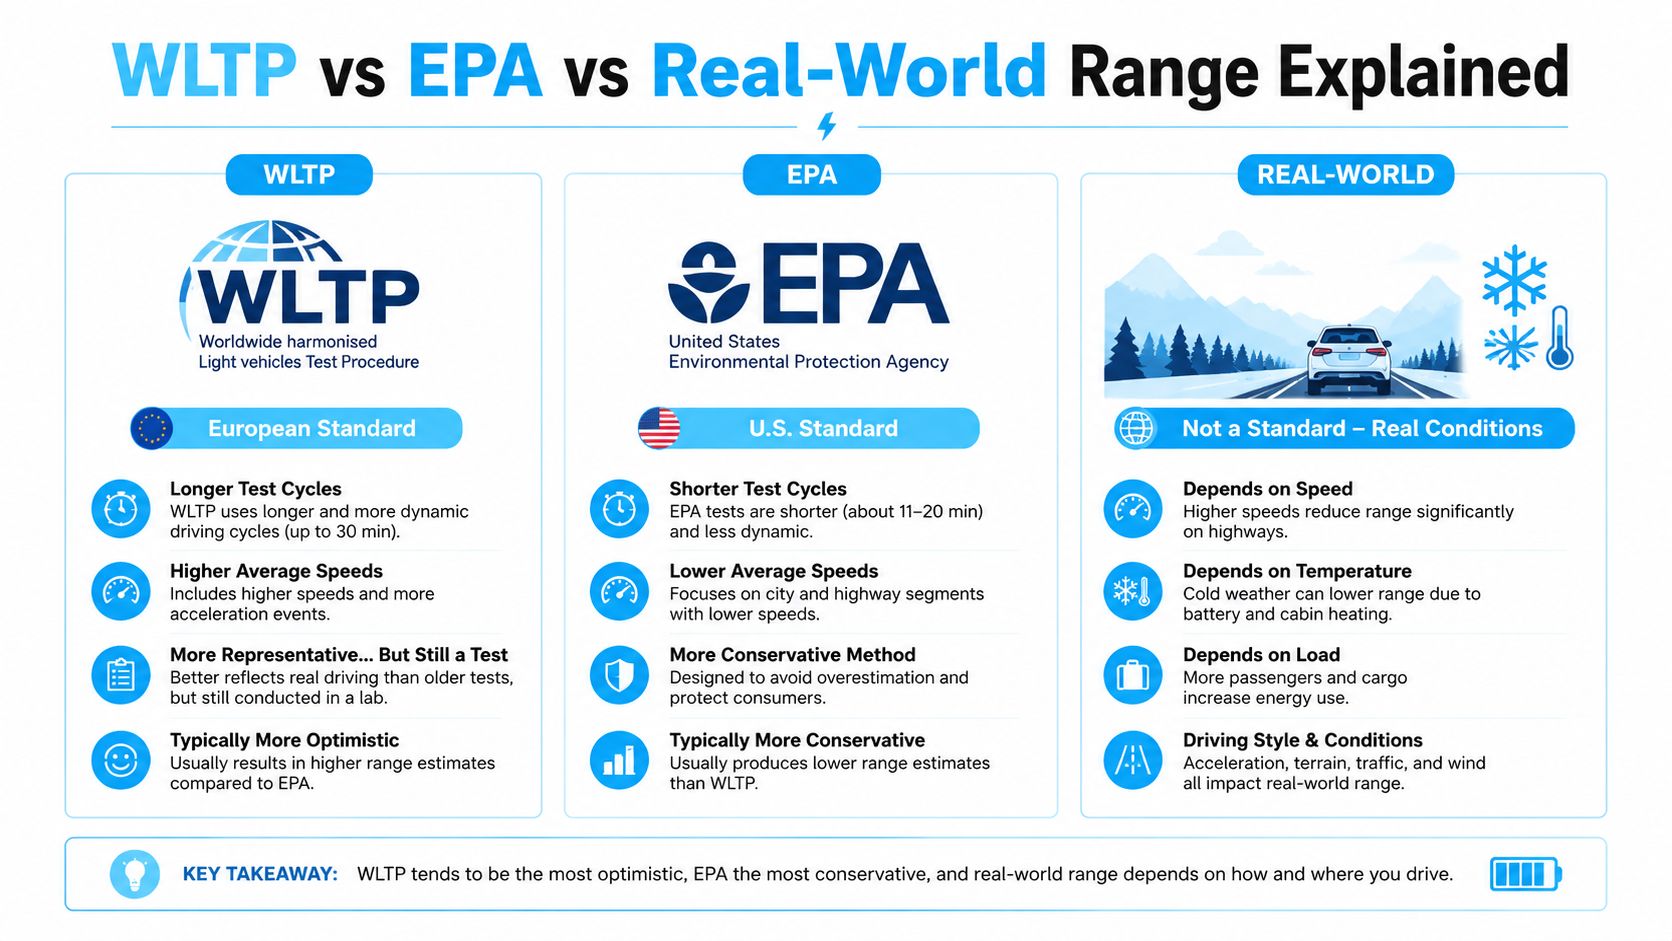
WLTP, used widely in Europe, combines varied driving conditions in a standardized cycle. EPA testing in the United States uses city and highway cycles, then applies adjustment factors intended to make the published result more conservative than an unadjusted laboratory result. Both figures are useful for comparing vehicles tested under the same framework, not for treating one number as a universal promise.
Why the figures diverge
A test cycle controls speed, temperature, route, and driving inputs. A highway journey does not. Higher speeds increase aerodynamic demand, while cold weather can reduce battery efficiency and add cabin-heating consumption. Hills, headwinds, roof equipment, passengers, and wet roads widen the gap.
Vehicle class also shapes the meaning of a published range. The IEA market analysis reports small cars averaging around 150 km in 2023, while large higher-end models reached around 360 to 380 km. The IEA range analysis therefore supports a narrower conclusion: range describes a tested vehicle class and configuration, rather than a general measure of EV capability.
Treat real-world estimates as scenario guidance. A combined figure in mild weather helps compare models, but it cannot answer a winter motorway question unless speed, temperature, heating, load, and battery preparation are comparable.
For model-by-model context, use this electric car range comparison as a starting point, then check whether each figure comes from laboratory testing, road testing, or a stated simulation.
Record at least three values:
- Published test range, for standardized comparison.
- Expected highway range, based on typical speed and load.
- Cold-weather range, including heating and battery-temperature effects.
Charging power belongs beside these range figures. A car with a lower brochure range can suit long trips better if it maintains charging power effectively and performs consistently in winter. The practical comparison is the distance available between stops, the energy used at the planned speed, and the time needed to restore it.
Battery Capacity and Energy Efficiency Metrics
Battery capacity is useful only when paired with usable energy and expected consumption. Older BEV models typically used packs of about 20 kWh in 2015, while newer models in 2022 to 2023 were around 50 kWh. The IEA recorded an average BEV battery capacity of 55 kWh in 2021, slightly below 56 kWh in 2020. The IEA battery capacity data illustrates how quickly the baseline has changed.
| Year | Average Capacity (kWh) | Market Context |
|---|---|---|
| 2015 | About 20 | Earlier BEV packs were typically much smaller |
| 2020 | 56 | Average capacity reached a higher mainstream level |
| 2021 | 55 | Average capacity was slightly lower than the previous year |
| 2022 to 2023 | Around 50 | Newer models remained centred around this capacity range |
Gross capacity versus usable capacity
Gross capacity is the pack's full physical energy storage. Usable capacity is the portion the vehicle permits for driving and charging. A reserved buffer at the top or bottom of the operating window can support thermal control, consistent performance, and battery durability.
As a result, two vehicles with the same gross capacity can provide different amounts of usable energy. For a more detailed explanation, see this guide to electric car battery capacity. If a manufacturer publishes only one capacity figure, check whether it means gross or usable capacity before comparing models.
Efficiency is the bridge between battery and range
Wh/km indicates how much energy a vehicle uses to travel one kilometre. Lower consumption generally improves range, but the test context must match the intended trip. A city-oriented figure may say little about winter motorway driving, where aerodynamic drag, cabin heating, wind, road conditions, and speed can raise consumption.
The basic relationship is:
Estimated distance = usable battery energy ÷ energy consumption
Use an estimated consumption value for the planned route, rather than copying a laboratory figure into a highway calculation. Apply the same conditions to every model, including speed, temperature, passengers, luggage, elevation, and heating demand. Keep a reserve for traffic, weather, and limited charging availability instead of planning to arrive with the battery nearly empty.
Battery demand is also scaling beyond individual vehicle packs. Global EV battery demand exceeded 750 GWh in 2023, up 40% from 2022, and reached 1.2 TWh in 2025, about seven times higher than in 2020, according to the IEA's global EV battery outlook. For buyers, the practical implication is clear: compare capacity with efficiency and charging conditions, not as a standalone measure of highway or winter range.
Powertrain Specifications and Performance Data
Powertrain specifications answer how an EV produces and sustains motion. They matter most when the trip includes motorway speeds, steep grades, winter temperatures, or towing, conditions that can expose limits hidden by a short acceleration test.
Motor power appears in kilowatts or horsepower. Peak output describes a maximum available under defined conditions. Continuous output better indicates sustained load. An EV may accelerate sharply for a brief period, then reduce output as battery state of charge, temperature, or cooling capacity limits performance. A brochure's peak figure therefore says little about repeatable highway acceleration by itself.
Motor and drivetrain choices
Permanent-magnet motors often combine efficiency with compact packaging. Induction motors avoid permanent magnets and can suit systems that switch between efficiency and higher output. Axial-flux designs use another motor geometry, with potential size or mass advantages in particular applications. The motor type alone does not predict road performance. Inverter control, software, cooling, gearing, tyres, and battery output determine how effectively the specification becomes traction.
Single-motor layouts generally reduce complexity and energy demand. Dual-motor systems can provide all-wheel drive and distribute torque between axles. A tri-motor layout can add control and acceleration, while increasing weight, cost, and consumption. For winter or wet-weather driving, the relevant question is how the system manages traction without imposing a persistent efficiency penalty.
Torque needs context
Electric motors can produce strong torque from low rotational speed, giving immediate response without waiting for engine revs. Torque figures remain difficult to compare across brands because a manufacturer may quote motor torque, wheel torque, or a system total. Gearing changes the force delivered at the tyres, so the headline number is not a complete performance measure.
Read the specification sheet alongside the intended trip:
- Peak power: indicates maximum acceleration potential.
- Continuous power: better reflects extended high-load driving.
- Drivetrain layout: affects traction, efficiency, and handling.
- Thermal management: determines how consistently output can be repeated.
- Towing rating and payload: set practical load limits.
- Regenerative braking control: affects one-pedal driving and downhill energy recovery.
A high-output EV helps with merging and overtaking, but long-distance buyers may benefit more from low consumption and stable performance after repeated high-speed use. Compare powertrain data with expected temperature, speed, load, and road gradient. That normalizes the brochure figures against the conditions that determine highway and winter performance.
AC and DC Charging Specifications Decoded
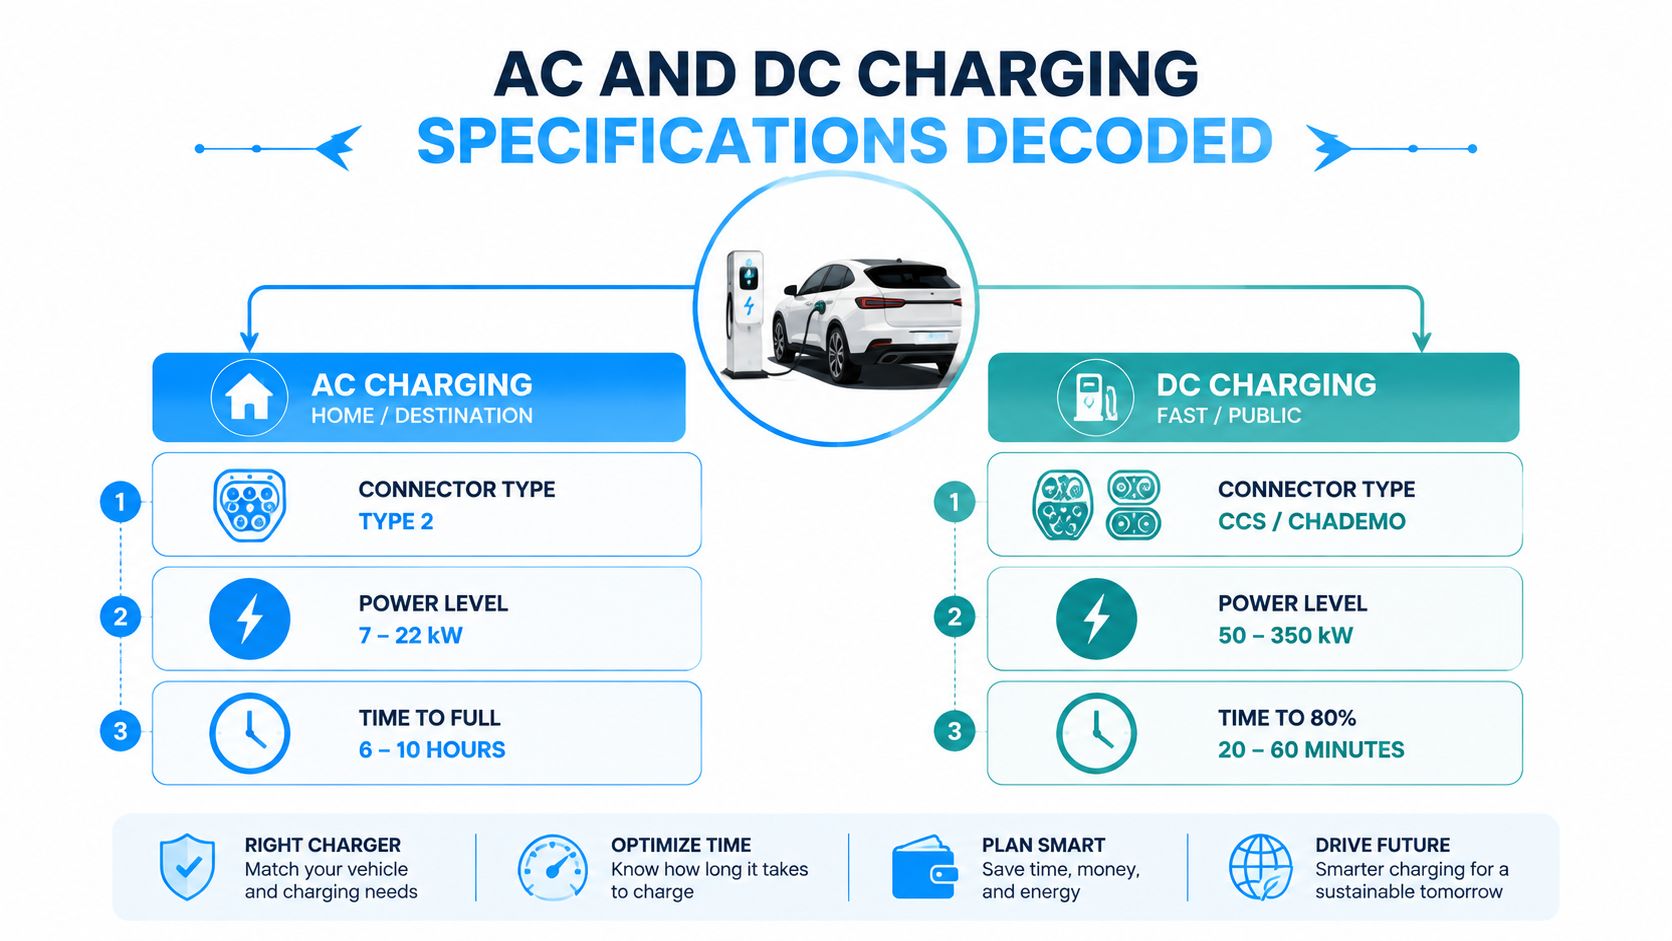
Which charging specification predicts a faster highway trip, the highest peak number or the power sustained after the battery and charger heat up? The answer depends on the complete charging system, not one figure in a brochure. AC charging sends alternating current to the vehicle, where its onboard charger converts it for the battery. DC fast charging delivers direct current through external equipment, bypassing that smaller onboard converter and enabling higher charging power.
Reading connector and power data
Type 1 and Type 2 are AC connector formats used in different markets. CCS combines an IEC 62196 Type 1 or Type 2 AC connector with two additional DC contacts. The Combined Charging System technical reference describes requirements supporting AC supply voltages up to 1,000 V and DC voltages up to 1,500 V. Practical CCS systems are often discussed around 200 A and 200 kW-class hardware, while some CCS2 documentation rates the connector at up to 1,000 V DC and 200 A.
CHAdeMO is another DC charging standard, while NACS is a separate connector approach used in North America. Plug shape alone does not establish compatibility. The vehicle, charger, market, software, payment system, and charging network must all support the session.
Peak power isn't session time
A high DC peak may apply only within a limited battery state-of-charge window. As the pack fills, the vehicle normally reduces power to control heat and protect the cells. The charging curve therefore matters more than the maximum printed in bold.
Record these fields when comparing models:
- AC input limit: sets home and destination charging speed.
- DC peak limit: states the upper boundary at a compatible station.
- Charging curve: shows how long high power lasts.
- Battery preconditioning: affects readiness on arrival at a fast charger.
- Connector standard: determines where the vehicle can plug in.
- Energy added per minute: often gives a better trip estimate than peak kW.
A vehicle with a lower peak can complete a journey sooner if it sustains useful power through the session. A spectacular peak offers little value when compatible stations are limited or the vehicle tapers quickly. Cold weather can further reduce charging performance, so highway comparisons should include battery temperature, arrival state of charge, and the energy required for the next leg.
For a practical explanation of charging categories, consult this EV charging levels guide, then compare the vehicle's limits with the equipment available at home, work, and on regular routes.
How to Normalize Specifications Across Models
How can two electric cars with similar brochure figures deliver different results on a winter motorway trip? Raw specification sheets combine test standards, measurement units, currencies, trims, and battery definitions. A fair comparison requires one framework applied consistently to every model.
Begin with range and consumption. Use kilometres or miles throughout the calculation, then convert efficiency to a shared unit such as Wh/km. Label whether each range figure uses WLTP or EPA testing, because those results are not directly interchangeable. For highway or cold-weather planning, replace the headline figure with an estimate based on speed, temperature, payload, and route.
Build a comparison worksheet
Separate fields that manufacturers often combine:
| Field | Normalized question |
|---|---|
| Range | Which test standard produced the figure? |
| Battery | Is the capacity gross or usable? |
| Efficiency | Is the value laboratory-based or measured in real driving? |
| Charging | What is the AC limit, and how does DC power hold over the session? |
| Price | Which currency, market, trim, and equipment level apply? |
| Practicality | What payload, luggage, seating, and towing requirements must it meet? |
Price comparisons also need matching conditions. Use the same market, tax treatment, trim, incentives, and included equipment. A lower headline price may correspond to a smaller battery, slower charging hardware, or missing features required to match the other vehicle.
Apply the route before ranking the car
Define one representative journey for every candidate. Include distance, motorway share, outside temperature, target speed, elevation, payload, starting charge, arrival reserve, and available chargers. Estimate energy use and charging time from those inputs, rather than ranking cars by laboratory range alone.
The result exposes trade-offs hidden by simple tables. A vehicle with strong laboratory efficiency may take longer on a highway trip if its DC charging curve falls sharply. A model with a larger battery may reduce stop frequency while consuming more energy per kilometre. Cold temperatures can affect both range and charging readiness, so record the conditions used in the comparison.
The best comparison unit isn't the brochure range. It's the energy and charging time required to complete your regular journey with a sensible reserve.
Keep every assumption visible. An auditable worksheet shows whether a result depends on charging power, temperature, route speed, or battery capacity, instead of turning a polished specification table into another marketing exercise.
What Buyers Should Compare Before Deciding
Can the car complete a familiar journey at motorway speed, in cold weather, with charging stops that fit your schedule? That question is more useful than comparing maximum laboratory range. The specification sheet becomes meaningful only after it is converted into the conditions you drive.
Available examples illustrate the scale of the adjustment. The Tesla Model Y RWD is shown at about 400 km of combined mild-weather range, falling to about 290 km in cold weather. The Smart #5 Summit Edition moves from about 520 km in mild weather to about 390 km in cold conditions, according to the IEA's EV market data. These figures are not a replacement for a route estimate, but they show why a winter motorway trip cannot be planned from one combined figure.

Compare the trip, not the headline
Build one representative journey for every candidate. Record the distance, motorway share, target speed, outside temperature, elevation, payload, starting state of charge, desired arrival reserve, and charger locations. Estimate energy use and charging time from those inputs, then compare the number of stops and the energy added at each stop.
For example, a car that needs two short charging stops may be preferable to one that needs a single longer stop, even if both complete the route with the same reserve. The result depends on the charging curve, not only the advertised peak DC power. A vehicle may briefly reach its headline rate before tapering, while another sustains a lower rate for longer.
Charging access also affects the comparison. More public and private charging points increase route choice, but the useful question is whether a suitable charger is available at the required point in the journey, with enough power and acceptable availability. Record those assumptions instead of treating charger counts as a substitute for route planning.
Ask:
- Highway consumption: What does the vehicle use at my normal cruising speed?
- Cold-weather reserve: How much energy remains with heating operating?
- Charging stop pattern: Where would I stop, and how much would I add?
- Power availability: Can the route supply the vehicle's expected DC input?
- Arrival margin: What happens if a charger is busy or weather worsens?
A smaller, efficient EV with dependable charging may suit regular travel better than a larger-battery model that charges slowly. Compare usable distance, energy consumption, charging curve, route coverage, and reserve as one trip requirement, rather than treating range as the decision by itself.
Quick Reference Guide to EV Specification Terms
Which specification predicts your next highway trip, and which only describes a laboratory result? Use this glossary to read manufacturer pages and comparison sheets without treating one range figure as the whole vehicle. Definitions below emphasize how each term changes with speed, temperature, load, and charging conditions.
Charging and energy
- AC: Alternating current. The vehicle's onboard charger converts it into energy the battery can store. AC power therefore depends on the car's onboard charger as well as the wallbox.
- Ah: Ampere-hour, a measure of electrical charge. It needs voltage context before it indicates stored energy, so it cannot replace a kWh figure.
- DC: Direct current. Public fast chargers deliver it directly to the battery system, subject to the vehicle's limits and battery conditions.
- kW: Kilowatt, a measure of power. It describes motor output and charging rate, not energy stored.
- kWh: Kilowatt-hour, a measure of stored or delivered energy commonly used for battery capacity.
- Usable capacity: Energy available to the driver. It can be lower than gross capacity because the battery management system reserves part of the pack.
- Wh/km: Watt-hours per kilometre. A lower value generally means better efficiency under comparable speed, temperature, terrain, and load.
Range and testing
- EPA range: A U.S. range result from the EPA testing process and adjustment method.
- WLTP range: A standardized range result widely used in Europe. It is a test reference, not a guarantee of highway or winter distance.
- Real-world range: A measured or estimated result under defined road conditions, including speed, temperature, terrain, and load.
- Charging curve: The change in charging power during a session as state of charge and battery conditions change. Peak kW alone cannot predict total charging time.
Powertrain and practicality
- BEV: Battery electric vehicle, powered by electricity stored in a traction battery.
- Regenerative braking: Converts some deceleration energy into electricity.
- Single motor: One traction motor, often supporting simpler packaging or lower consumption.
- Dual motor: Motors on separate axles or drives, often providing all-wheel drive.
- Payload: The combined weight of passengers, luggage, and other carried loads.
- Towing rating: Permitted trailer mass under the manufacturer's stated conditions.
Read kWh with Wh/km, range with its test standard, and peak charging power with the charging curve. That combination gives a more useful highway and winter comparison than any isolated brochure number.
Tools and Resources for Independent EV Research
Which EV specification will survive your actual route, winter temperature, and charging network? Independent research should answer that question by combining manufacturer data, comparable test results, and scenario-based calculations. Manufacturer pages establish equipment, battery capacity, drivetrain, and charging limits, but trim assumptions and test standards can differ. Comparison databases are useful only when they identify sources and keep definitions visible.
Begin with physical fit. Check body style, seating, luggage space, payload, towing requirements, and drivetrain before sorting models by range. Then compare usable battery capacity, efficiency, AC input, DC charging power, charging behaviour, and performance. A ranking can narrow the field, while a route model shows whether a vehicle works at motorway speed or in cold weather.
A practical research sequence
- Confirm the use case: Separate city driving, highway travel, fleet duty, towing, and family transport.
- Normalize the units: Use one distance, energy, and currency system across every model.
- Separate test results: Keep WLTP, EPA, and independent real-world figures in different fields.
- Model charging: Estimate stops, energy added, session duration, charging-curve effects, and charger compatibility.
- Check ownership: Include energy, maintenance, depreciation, insurance, and installation assumptions in a total-cost model.
- Audit the source: Prefer transparent manufacturer data and clearly identified independent tests.
Useful tools include side-by-side comparisons, efficiency and range tables, charging simulators, and total-cost-of-ownership calculators. Their outputs are meaningful only when inputs are explicit. Check whether the battery figure is usable or gross, which test standard supplies the range, and whether charging time reflects peak kW or observed charging power over the session.
Finish with a written decision record: expected highway range, cold-weather reserve, charging pattern, practical constraints, and ownership assumptions. That record exposes brochure claims that fail under trip conditions and makes comparisons easier when the route or vehicle configuration changes.
EV Stats combines official specifications with independent test context in a structured EV database. Its comparison tools, range and charging analysis, TCO Calculator, and Charging Simulator help normalize electric car specifications and test whether advertised strengths match real driving needs. Use EV Stats for that comparison.