

You're comparing two electric cars before a long journey. Both advertise the same official range, yet one may need fewer charging stops, use less electricity on your commute, and behave more predictably on a cold motorway trip. The difference isn't hidden in the range badge. It's in electric car efficiency, the amount of energy the vehicle needs to travel a given distance.
That makes efficiency a better starting point than battery size or headline range. Once you know how to read the units, account for speed and temperature, and compare cars under matching conditions, you can choose an EV for the journeys you make. The US label unit for the same idea is MPGe. For a weekday route, the commuting guide ranks compact catalog rows by that figure.
Table of Contents
- Why Electric Car Efficiency Matters
- Understanding the Main Efficiency Metrics
- What Changes EV Energy Consumption
- Efficiency Across Real Driving Scenarios
- How to Compare EV Efficiency Fairly
- Avoiding Common EV Efficiency Mistakes
- Choosing the Right EV for Your Needs
Why Electric Car Efficiency Matters
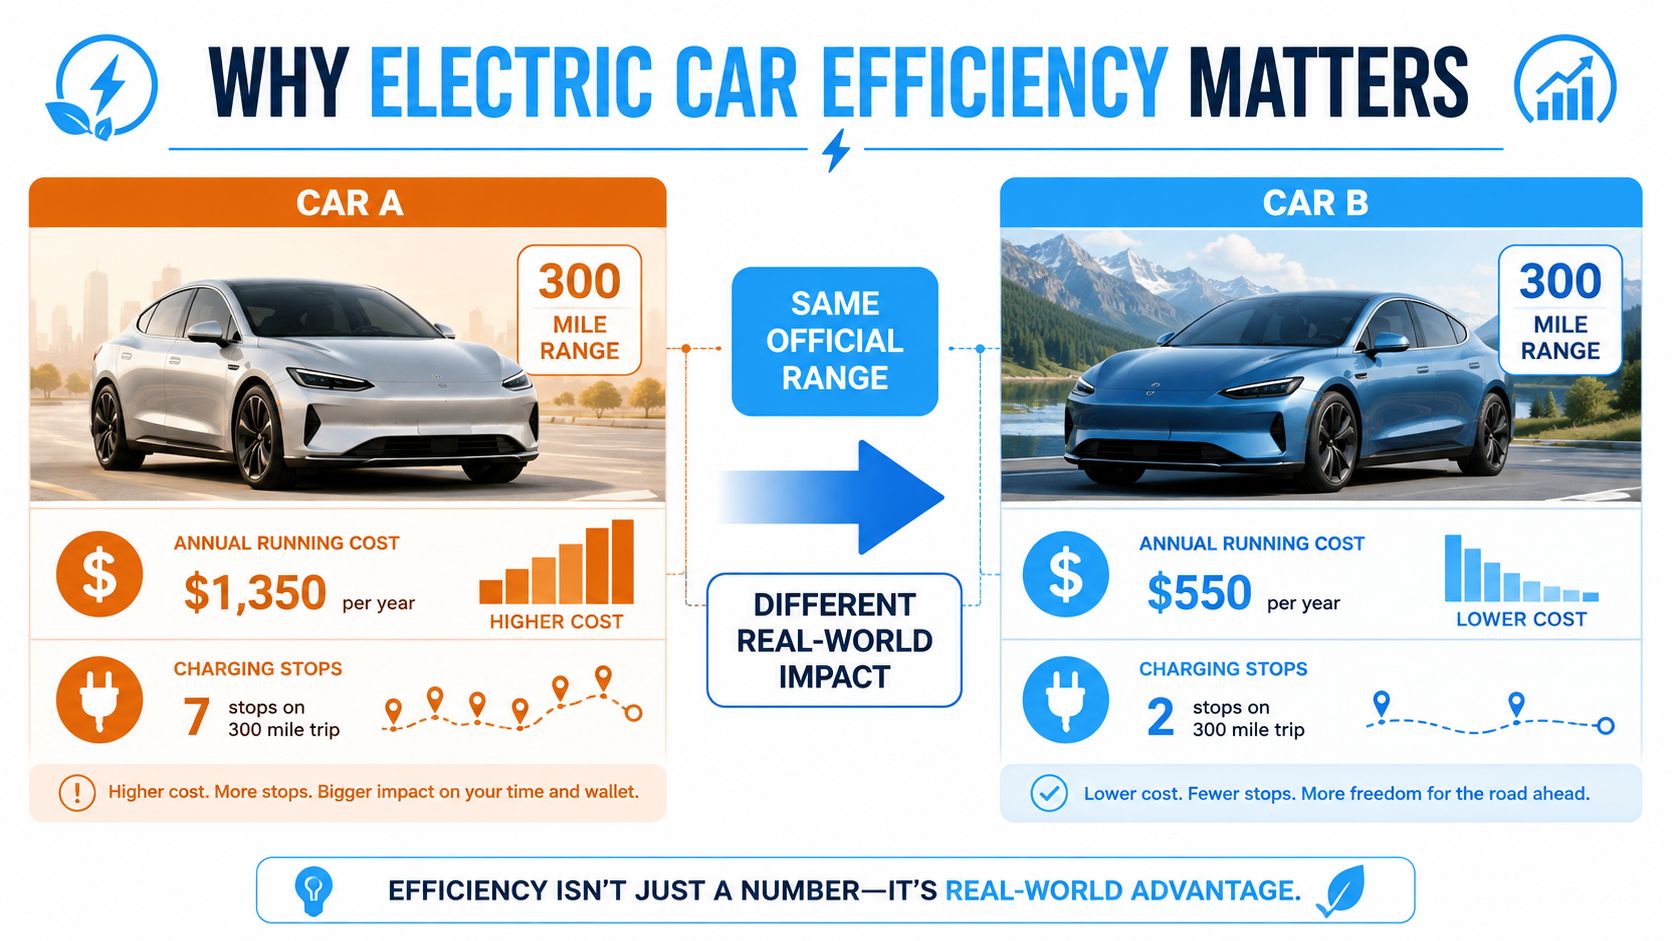
Two shoppers, Sam and Priya, are looking at electric cars with the same official range. Sam assumes the cars will cost roughly the same to run because each can travel the same distance between charges. Priya checks their energy consumption and notices that one requires more kilowatt-hours for every kilometre.
That distinction changes daily ownership. The less efficient car may draw more electricity for the same commute, reach a lower practical range on a fast motorway, and require an extra charging stop on a long trip. The battery can still be the same size, and the official range can still look identical, but the cars won't deliver the same experience.
The basic relationship is simple:
Range = usable battery energy ÷ energy consumed per distance
A larger battery can increase range, but it doesn't automatically make a vehicle efficient. Efficiency tells you how effectively the vehicle turns stored electricity into movement. The U.S. Department of Energy reports that a typical EV is 87% to 91% efficient when regenerative braking is included, compared with about 30% for a conventional gasoline vehicle on the same basis. The DOE attributes part of the EV result to 65% to 69% of stored energy reaching the wheels, with about 22% recovered through regenerative braking on the EPA combined city and highway cycle. See the U.S. Department of Energy explanation of EV efficiency for the underlying breakdown.
Efficiency affects more than electricity bills
Energy consumption influences several decisions at once:
- Running cost: A car that uses fewer kWh for the same journey needs less electricity, although the final bill also depends on your electricity tariff and charging losses.
- Charging frequency: Lower consumption leaves more usable energy for each charge, so you may stop less often.
- Battery requirements: An efficient vehicle can achieve a useful range with a smaller battery, while a heavier or less aerodynamic design may need more stored energy.
- Long-distance confidence: Motorway speed, cold weather, heating, passengers, and luggage can all reduce practical range, making efficiency especially important away from laboratory conditions.
Oak Ridge National Laboratory's assessment of U.S. plug-in vehicles found that new battery-electric vehicles sold in 2021 averaged 29.4 kWh per 100 miles, while the fleetwide plug-in average was 32.1 kWh per 100 miles. The same report says the entire plug-in fleet improved from nearly 36 kWh per 100 miles to about 32 kWh per 100 miles by 2019. These results show why efficiency is a useful measure of technological progress, independent of battery capacity. The Oak Ridge National Laboratory assessment provides the historical context.
For a practical cost comparison, use electric car cost per mile alongside consumption. Range tells you how far the car might go. Efficiency tells you how much energy it takes to get there.
Understanding the Main Efficiency Metrics
Electric cars use several efficiency units, but they describe the same relationship between electricity and distance. The easiest way to understand them is to compare them with familiar fuel economy.
A gasoline car might be described by litres per 100 kilometres. That is an amount of fuel consumed over a fixed distance. EV efficiency is often expressed in kilowatt-hours per 100 kilometres, written as kWh/100 km. A lower number is better because the car uses less energy to travel that distance.
Start with kWh per 100 kilometres
Suppose an EV records 15 kWh/100 km. It needs 15 kilowatt-hours to travel 100 kilometres under the conditions measured. For a 200-kilometre journey, the simple estimate is:
15 kWh/100 km × 2 = 30 kWh
The calculation is useful because it connects directly to the energy stored in the battery and the electricity drawn during a journey. If your dashboard shows 18 kWh/100 km instead, the same 200-kilometre trip would require 36 kWh before considering charging losses or changes in conditions.
Convert to watt-hours per kilometre
One kilowatt-hour equals 1,000 watt-hours. To convert 15 kWh/100 km into Wh/km, multiply 15 by 1,000 and divide by 100:
15 × 1,000 ÷ 100 = 150 Wh/km
So 15 kWh/100 km = 150 Wh/km. This format appears frequently in vehicle dashboards, test reports, and technical discussions because it gives a more precise view of small changes. A drop from 150 Wh/km to 145 Wh/km may look modest, but it represents lower energy use over every kilometre.
Use miles per kilowatt-hour for distance efficiency
Some dashboards and U.S. comparisons use miles per kWh. This reverses the relationship. Instead of asking how much energy the car needs to cover a distance, it asks how far the car travels on one unit of energy.
An EV using 15 kWh/100 km travels about 62.1 miles for every 15 kWh. Divide that distance by the energy:
62.1 ÷ 15 ≈ 4.2 miles/kWh
Therefore, 15 kWh/100 km is approximately 4.2 miles/kWh. In this format, a higher number is better. That reversal causes many comparison errors.
Conversion rule: Lower kWh/100 km and Wh/km are better. Higher miles/kWh is better.
Use one unit before ranking models. European specifications commonly use kWh/100 km, while U.S. labels may present miles/kWh or kWh/100 miles. Enthusiast dashboards often use Wh/km. A converter is useful, but the arithmetic matters because it reveals which figures are inverses rather than interchangeable labels.
Official consumption figures come from standardised laboratory procedures. They provide a consistent baseline, but they don't reproduce every driver's speed, temperature, traffic, terrain, payload, or climate-control use. Treat the rating as a reference point, then test how far the number moves in your own conditions.
What Changes EV Energy Consumption
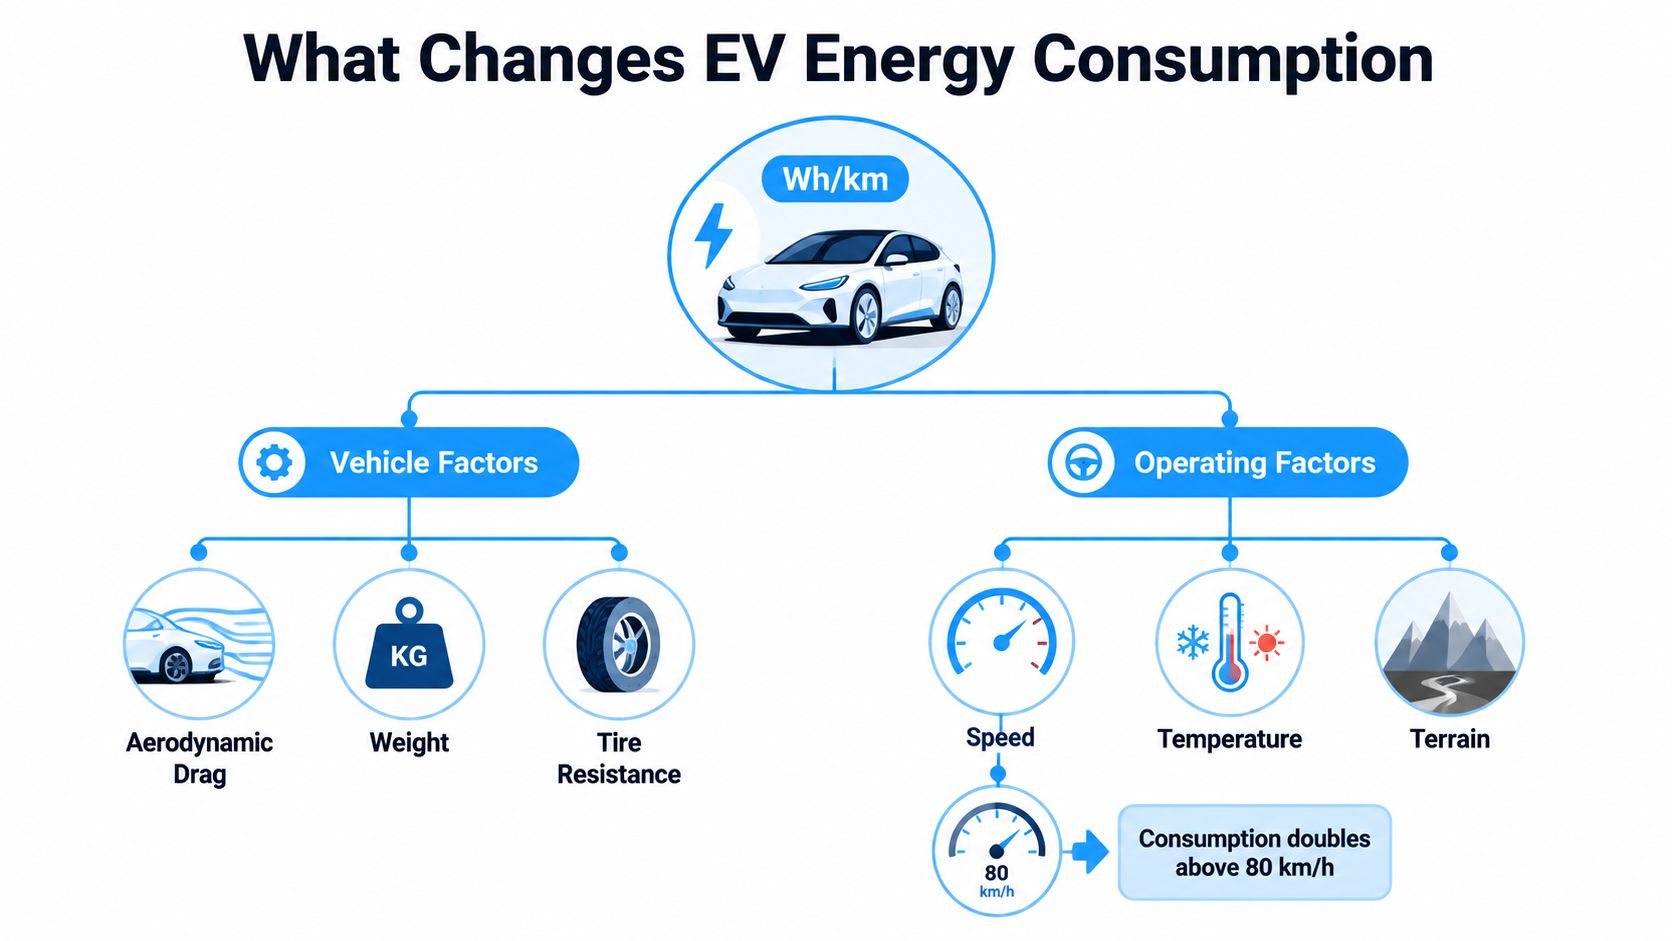
An EV's consumption figure is an outcome, not a permanent property. The vehicle establishes a baseline through its design, while speed, weather, terrain, traffic, and driver inputs shift the result during every trip.
Speed changes the aerodynamic equation
At urban speeds, rolling resistance and repeated acceleration matter greatly. At motorway speeds, aerodynamic drag becomes much more influential. Air resistance rises rapidly as speed increases, so a car that looks efficient around town can consume substantially more during sustained high-speed travel.
This is why a city rating shouldn't stand in for motorway performance. A tall SUV, broad crossover, or vehicle carrying roof equipment presents more area to the air than a low, sleek hatchback. The motor may be equally efficient, but the body has to push through more resistance.
Temperature affects several systems at once
Cold weather can reduce efficiency through battery temperature, cabin heating, tyre pressure, and increased rolling resistance. Heating the cabin also draws energy that could otherwise move the car. A 2025 real-world study found that compressor load alone could raise overall energy consumption by up to 52%, while energy use at -10 °C was about 50% higher than at 30 °C. The study also reported a significant reduction in regenerative-braking efficiency in cold conditions. Those findings are detailed in this peer-reviewed analysis of EV energy consumption.
Independent winter testing found fleet-wide energy use around 21 to 24 kWh/100 miles, with SUVs and older platforms closer to 26 to 28 kWh/100 miles. The same coverage found winter highway range losses of roughly 35% to 55% against rated figures, depending on vehicle type and aerodynamics. In more moderate conditions, recent testing found actual range could trail official figures by 5% to 14%. These results come from independent winter EV highway testing.
Design and driving complete the picture
Vehicle weight, frontal area, tyre width, rolling resistance, drivetrain calibration, and underbody airflow all influence the starting figure. A larger EV battery capacity stores more energy, but it may also add mass that the vehicle must carry.
Accessories create additional loads. Heating, air conditioning, demisting, heated seats, roof boxes, and heavy cargo all change the amount of energy available for propulsion. Smooth acceleration, anticipation, sensible tyre pressure, and route choice can reduce waste, while steep climbs, wet roads, aggressive acceleration, and high speeds increase consumption.
For a visual explanation of how these factors interact, watch the following guide:
The useful question isn't “What is this car's efficiency?” It's “What consumption should I expect from this car on my route, in my weather, at my speed?”
Efficiency Across Real Driving Scenarios
A single EV can produce very different results across one week. Consider a representative mid-size electric SUV with a 60 kWh usable battery. The following examples use the scenario figures supplied for comparison, not a promise about every model or journey.
| Scenario | Typical kWh/100 km | Energy used in 100 km | Approx. range from 60 kWh |
|---|---|---|---|
| City commute | 14 to 16 | 14 to 16 kWh | 375 to 429 km |
| Motorway at 120 km/h | 19 to 22 | 19 to 22 kWh | 273 to 316 km |
| Cold-weather school run | 16.8 to 20.8 | 16.8 to 20.8 kWh | 288 to 357 km |
The city journey benefits from lower speeds and regenerative braking. If the vehicle averages 15 kWh/100 km, it uses about 15 kWh for every 100 kilometres. Dividing 60 kWh by 15 kWh/100 km gives an approximate theoretical range of 400 kilometres.
The motorway example uses the same calculation. At 20 kWh/100 km, 60 kWh divided by 20 kWh/100 km gives about 300 kilometres. That is a major reduction without changing the battery, because aerodynamic drag and sustained speed have changed the energy required for each kilometre.
Cold trips compound small penalties
The school run may involve a cold battery, cabin heating, short journeys, repeated stops, and time spent warming the vehicle. Applying the supplied 20% to 30% winter increase to a 14 to 16 kWh/100 km city baseline produces roughly 16.8 to 20.8 kWh/100 km. At the upper end, the same 60 kWh battery would provide about 288 kilometres in the simplified calculation.
These are planning estimates. They don't account for charging losses, reserve energy, wind, hills, payload, traffic, or battery temperature management. They demonstrate the principle: range is the result of battery energy and context-specific consumption, not a fixed distance printed on a specification sheet.
For model-to-model context, use a real-world electric car range comparison that separates laboratory figures from practical driving conditions. A car with a slightly smaller battery may still work better for your commute if its lower consumption offsets the capacity difference.
How to Compare EV Efficiency Fairly
Fair comparison requires consistent units, consistent battery definitions, and relevant test conditions. Use this process before deciding that one model is more efficient than another.
1. Standardise the unit
Convert every result to kWh/100 km, or use Wh/km if your driving data is recorded that way. For example, 3.8 miles/kWh converts to approximately 16.5 kWh/100 km. Without conversion, it's easy to mistake a higher miles-per-kWh number for higher consumption.
Keep official figures separate from owner reports and independent tests. Label each one by source and condition rather than placing them in one undifferentiated ranking.
2. Check usable battery energy
Gross battery capacity and usable capacity aren't always the same. Manufacturers may reserve energy at the top or bottom of the pack for protection and control. Range calculations should use the energy the driver can access, not merely the largest advertised battery figure.
If usable capacity isn't clearly published, mark the result as uncertain. A larger gross pack doesn't automatically deliver a longer practical range if the car is heavier or consumes more energy.
3. Match the test to your routine
A commuter should give more weight to urban and mixed-driving results. A motorway driver should prioritise sustained high-speed testing, while a winter user needs cold-weather results with heating active. WLTP combined data creates a useful common reference, but it can't answer every route-specific question.
4. Read independent tests at your speeds
Look for tests that state speed, temperature, wind, traffic, wheel size, tyre type, passengers, and starting battery conditions. A result measured on a calm day at moderate speed won't predict a winter motorway journey as closely as a test that resembles it.
Practical rule: Compare cars under the conditions you want to survive, not only the conditions used to produce the most attractive rating.
5. Include charging behaviour
Efficiency determines how much energy the car needs on the road. Charging performance determines how quickly you can replace that energy. A vehicle can use little electricity per kilometre yet still require more travel time if its charging curve drops quickly or its route-compatible charger is unavailable.
Peak charging power alone isn't enough. Examine the charging curve, the energy added during a normal stop, and the way those results fit your routes.
A short comparison checklist
- Same units: Convert all figures before ranking.
- Same battery definition: Use usable energy where possible.
- Same conditions: Match speed, weather, terrain, and payload.
- Same purpose: Separate commuting, motorway, and winter performance.
- Same charging context: Consider charging time as well as road consumption.
- Same ownership question: Include electricity, maintenance, depreciation, and charging access when evaluating total use.
This method won't produce one universal winner. It will show which model fits your specific operating pattern.
Avoiding Common EV Efficiency Mistakes
A large battery does not automatically make an electric car efficient. It stores more energy and can extend range, while its added mass may increase the energy required to move the vehicle. Start with the consumption figure, then choose enough usable battery capacity for the routes you typically drive.
Rated range is another common source of confusion. Laboratory figures help compare cars under a shared procedure, but they cannot represent every combination of motorway speed, cold weather, heating, hills, passengers, luggage, and wind. Two cars with the same official range may therefore deliver different results on a winter commute or a fast motorway journey.
Separate charging power from efficiency
Peak charging output indicates how quickly a vehicle may accept electricity under suitable conditions. It does not show how many kWh the car uses per kilometre. A highly efficient car may charge slowly, while a less efficient model may accept power quickly.
Evaluate both parts of the trip. Road efficiency determines how much energy the journey needs. Charging performance determines how long it takes to replace that energy, so fleet operators should also consider whether charging fits shift schedules and route timing.
Treat climate hardware as part of the vehicle
A heat pump, battery preconditioning, thermal management strategy, and cabin heating system can all affect cold-weather consumption. Resistive heating can add a substantial load, so winter comparisons should identify the climate system instead of treating every car as mechanically equivalent.
The 2025 real-world study cited earlier found that compressor load could raise total energy consumption by up to 52%, showing why climate hardware deserves more attention than a simple “heat pump present” tick box.
Battery age also needs careful interpretation. A 2025 comparison found nearly identical efficiency between high-mileage and low-mileage vehicles on the same trip. That result suggests that route conditions, tyres, weather, and vehicle systems can matter as much as mileage in ordinary use. Use battery health data where available, but do not treat the odometer as a complete efficiency forecast. Compare the models in conditions resembling your commute, motorway travel, winter use, or fleet routes.
Choosing the Right EV for Your Needs
The most efficient EV isn't automatically the best choice. The right model depends on whether you value low daily consumption, predictable fleet scheduling, or stable high-speed performance in difficult weather.
Household commuting and errands
For short urban trips, prioritise low Wh/km, compact dimensions, efficient climate control, and dependable home charging. A smaller battery may be adequate when the car consumes little energy and returns to a charger regularly. Weekend travel adds another test, so check motorway consumption before ruling out a model.
Fleet operation
Fleet managers need repeatable results more than an impressive single journey. Compare miles/kWh or kWh/100 km across typical routes, payloads, temperatures, and driver patterns. A vehicle with stable consumption makes scheduling easier because dispatchers can estimate energy needs without relying on optimistic laboratory assumptions.
Charging access matters just as much. Match the vehicle's charging curve to depot capacity, driver shifts, and route timing. A fleet should evaluate energy cost, downtime, maintenance, battery condition, and route suitability together.
Long-distance driving
Motorway travellers should focus on aerodynamic design, high-speed consumption, thermal management, usable battery energy, and charging-curve behaviour. A large pack can reduce the number of stops, but lower consumption may produce the same practical benefit with less stored energy.
Use a weighted score rather than a single leaderboard:
| Criterion | Commuter focus | Fleet focus | Long-distance focus |
|---|---|---|---|
| Rated consumption | High | High | Medium |
| Real-world route stability | Medium | High | High |
| Battery capacity | Medium | Medium | High |
| Thermal management | Medium | High | High |
| Charging curve | Medium | High | High |
| Total ownership cost | High | High | Medium |
The exact weighting should reflect your routes. Before choosing, ask:
- Consumption: What does the car use in my normal weather and traffic?
- Battery: How much energy is usable, not merely advertised?
- Climate: How does heating or cooling affect winter planning?
- Charging: Can the vehicle restore enough range during my usual stop?
- Ownership: What will each kilometre cost after energy, maintenance, and depreciation?
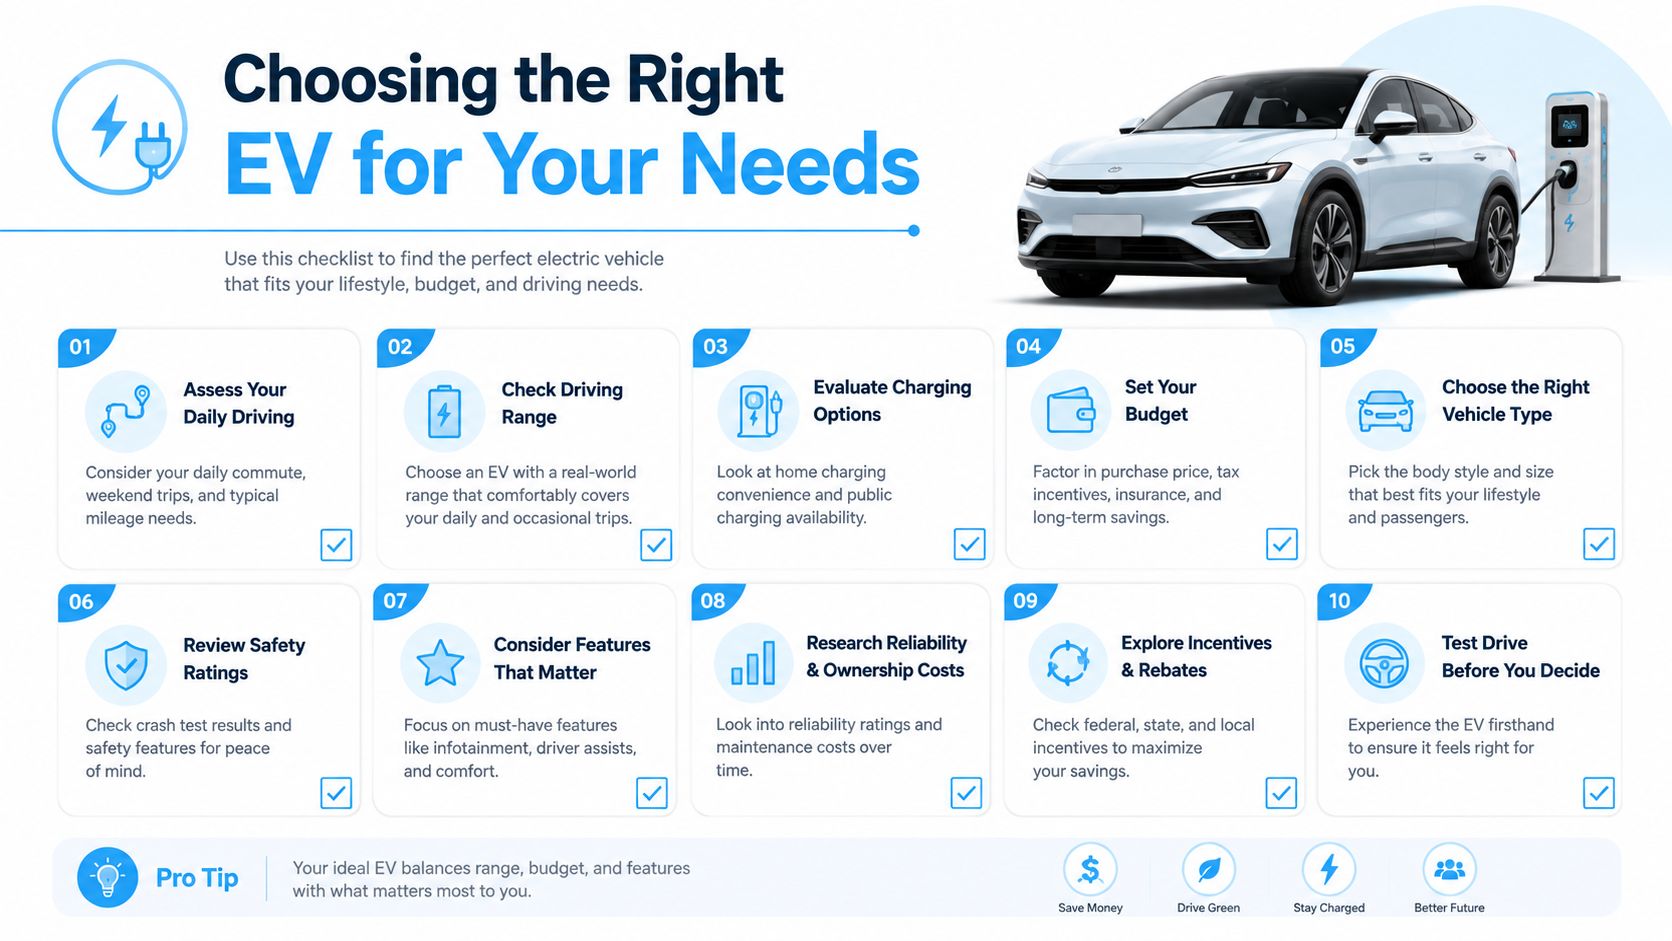
Electric car efficiency is most useful when it becomes a route-specific decision tool. Compare consumption, usable battery energy, charging behaviour, climate performance, and ownership cost together, then shortlist the models that match your actual driving rather than an idealised test cycle.
EV Stats offers an independent EV database with standardised specifications, real-world context, side-by-side comparisons, rankings, a total cost of ownership calculator, and a charging simulator. Visit EV Stats to compare electric car efficiency, range, charging performance, and ownership assumptions before you choose your next model.