


A typical electric vehicle is estimated to be 87%–91% efficient after regenerative braking is included, compared with about 30% for a conventional gasoline vehicle, according to the U.S. Department of Energy. That gap is the core reason for electric vehicle efficiency, because it explains why two cars with similar batteries can feel very different to own, charge, and drive.
Buyers often start with range because it's easy to compare. Efficiency is the more useful lens, though, because it shapes how much energy reaches the wheels, how often you'll plug in, and how well the car fits your daily route. It also changes with speed, weather, vehicle shape, and charging access, so a single spec-sheet number rarely tells the whole truth.
Table of Contents
- Why Electric Vehicle Efficiency Matters More Than Range
- How Energy Flows from Grid to Wheel
- Decoding Efficiency Metrics and Test Cycles
- Real-World Variables That Rewrite the Spec Sheet
- Efficiency, Cost, and the Charging Access Gap
- How to Compare EVs on Efficiency Using Standardized Data
- Putting Efficiency at the Center of Your EV Decision
Why Electric Vehicle Efficiency Matters More Than Range
That 87%–91% figure from the DOE is the headline number, but it doesn't tell the whole story for any single buyer. Efficiency is the sharper lens because it shows how much of the stored energy reaches the wheels, while range can be padded by a larger battery. Two EVs can post similar miles on the window sticker and still demand very different amounts of energy to get there.
A bigger battery can hide a weaker drivetrain. If one vehicle wastes more energy before the wheels start turning, it may still look competitive on range because it carries more stored energy. For the buyer, that extra capacity comes with tradeoffs, more mass to move, more cost to pay for, and more time spent charging.
Efficiency also shapes day-to-day ownership in ways range alone misses. It affects how far a car travels on each kilowatt-hour, how much usable range comes back from a short top-up, and how much pressure it puts on a home charger over time. For readers who want a range-only comparison first, this EV range guide lays out the basics, but it still leaves the efficiency question open.
Practical rule: if two EVs have similar range and one uses less energy to get there, the more efficient car usually gives you more room to manage charging and route planning.
Why the spec sheet isn't the whole answer
Lab ratings still matter, but they describe a controlled drive cycle, not your commute. Real drivers face traffic, hills, wind, cold mornings, and fast motorway runs, and each of those conditions changes how much energy the car uses. A car that looks tidy on paper can feel less efficient once the weather turns or the speed climbs.
That gap matters because efficiency is really about energy discipline. It tells you how well the car uses what it stores, not just how much it can hold. If you want fewer charging stops, less wasted energy, and a car that stays easier to live with across different kinds of driving, efficiency belongs near the top of the list.
How Energy Flows from Grid to Wheel
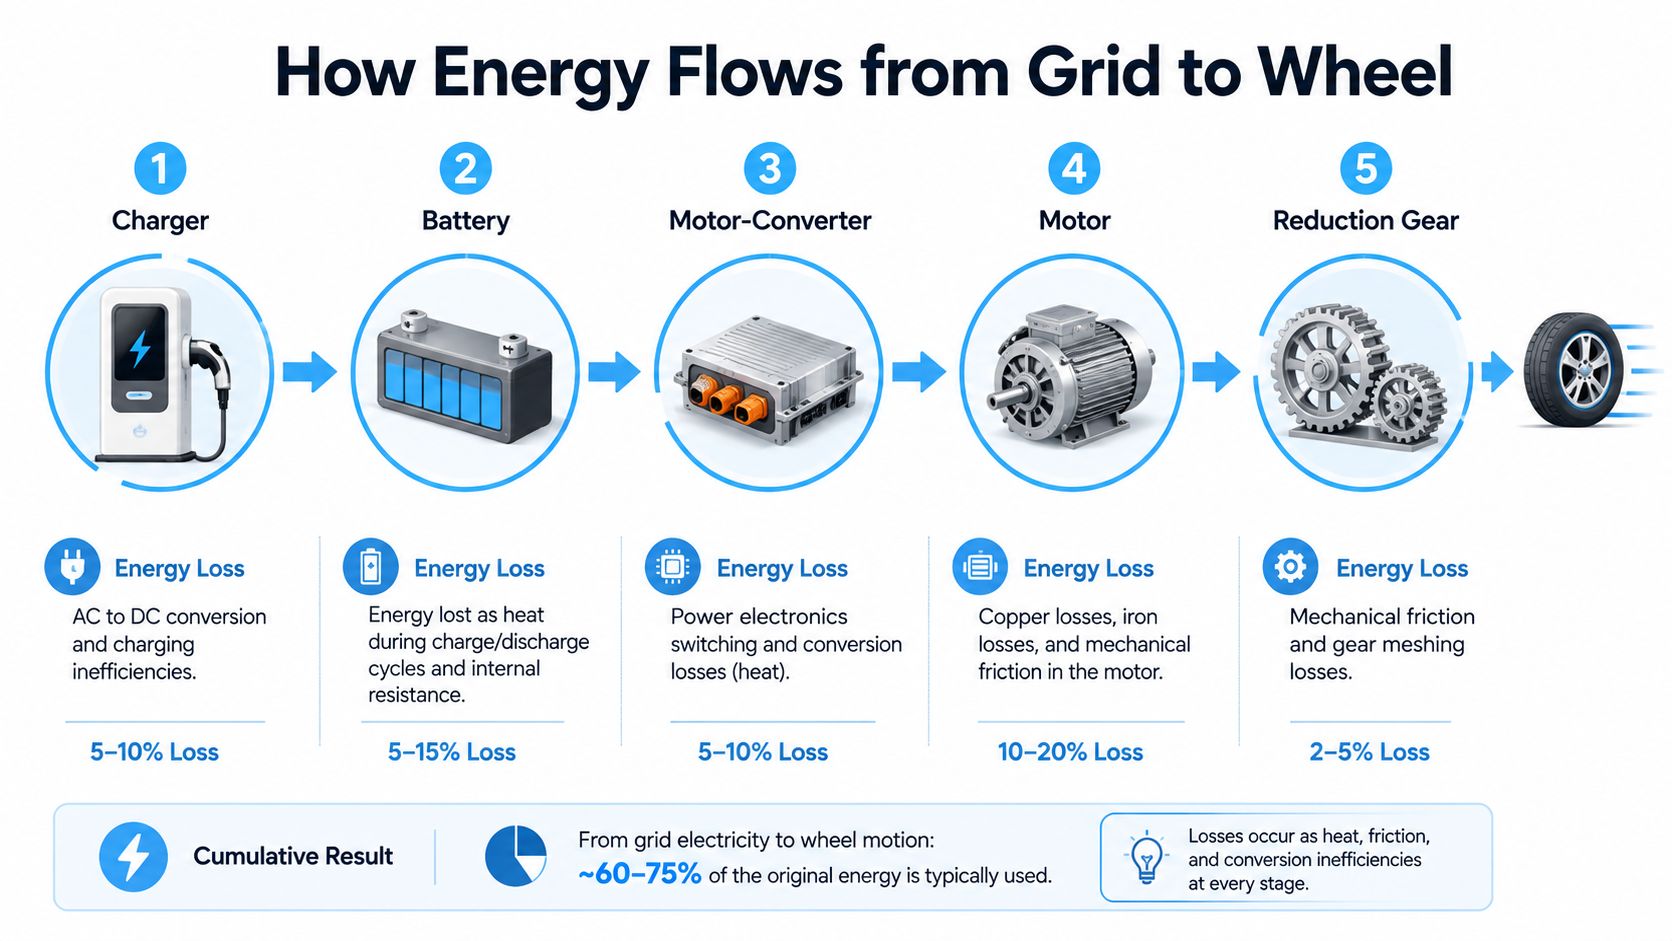
Think of electric vehicle efficiency like water moving through a series of pipes. The electricity starts at the grid, passes through the charger, fills the battery, then goes through the motor-converter, motor, and reduction gear before it finally turns the wheels. Each stage leaks a little energy, and the total loss is what buyers feel as lower efficiency.
A peer-reviewed analysis breaks that chain into charger, battery, motor-converter, motor, and reduction gear, with component efficiencies of 75%–95%, 78%–96%, 99%, 93%, and 95.6%, respectively, producing an overall electric-drive-train efficiency around 87% from tank to wheel hub and a well-to-wheel efficiency of 62% once generation and charging losses are included LUT publication. That same study says overall EV propulsion efficiency typically falls in the 45%–70% range, which is why model choice matters even inside the same segment.
Where the losses happen
The charger is the first bottleneck. If it's less efficient, more grid power disappears as heat before it even reaches the battery. The battery itself also loses some energy during storage and release, and the motor-converter has its own conversion overhead.
The useful mental model is simple. A narrow pipe before the tank, a leaky tank, and a well-designed motor won't perform the same as a wide pipe, a stable battery, and a high-efficiency motor working together. That's why buyers shouldn't fixate on battery size alone, because the path energy takes matters just as much as the amount stored.
Why component quality matters to buyers and fleets
For a procurement team, efficiency becomes a hardware question, not just a marketing one. A model with better charging behavior, a more efficient motor, and stronger thermal management can reduce waste even if it doesn't have the largest battery. For an individual buyer, that can mean fewer charging stops and a calmer daily routine.
The video below is useful as a visual companion to the flow diagram above, especially if you're trying to connect the engineering terms to the physical process.
The battery pack is only part of the story. The better question is how much of that stored energy reaches the road.
If you want a practical look at the charging side of the chain, this charging explainer helps connect the plug, the charger, and the battery without hiding the losses in jargon.
Decoding Efficiency Metrics and Test Cycles
Efficiency numbers only help when you know what unit and test cycle produced them. kWh/100 km, kWh/100 mi, and mi/kWh are all describing the same idea, but they tell the story from different angles. Lower kWh use means better efficiency, while higher miles per kWh means the same thing expressed as distance gained per unit of energy.
| Efficiency Unit Conversion Reference | ||
|---|---|---|
| kWh/100 km | kWh/100 mi | mi/kWh |
| 15 | 24.14 | 4.14 |
| 18 | 28.97 | 3.45 |
| 20 | 32.19 | 3.11 |
The table above is a simple reference, not a performance claim. It helps translate between common formats so you don't mistake a unit change for a real efficiency change. That matters because EV databases, manufacturer pages, and regional test systems don't always present numbers in the same way.
Why EPA, WLTP, and manufacturer figures can differ
Different test cycles produce different outcomes because they simulate different driving patterns. A manufacturer figure may look better than a real commute because it comes from controlled conditions that don't reflect your traffic, temperature, or route. A region's official cycle can also favor a particular type of driving, so two cars can look closer or farther apart depending on which test is used.
The safest habit is to compare like with like. If one listing uses miles per kWh and another uses kWh per 100 km, convert them before deciding which car is more efficient. If one result comes from a standardized lab cycle and another from real-world testing, treat them as useful but not identical signals.
How to read a leaderboard without getting fooled
A leaderboard is a starting point, not a verdict. It can tell you which cars are generally frugal, but it can't tell you whether your commute is mostly city traffic, long motorway stretches, or cold-weather starts. That's why a well-structured database with standardized units is valuable, it lets you compare the same metric across different vehicles instead of mentally juggling inconsistent labels.
The skill is reading the context behind the number. If you can identify the unit, the cycle, and the likely driving pattern, you'll avoid the most common comparison mistake, treating all efficiency figures as interchangeable when they aren't.
Real-World Variables That Rewrite the Spec Sheet
The spec sheet rarely tells you what happens at 110 km/h in winter with the heater on. Real-world electric vehicle efficiency changes because physics changes, and the three biggest disruptors are speed, temperature, and vehicle shape. The same car can look polished in lab testing and feel far less efficient once air resistance, cabin heating, and body size start to matter.
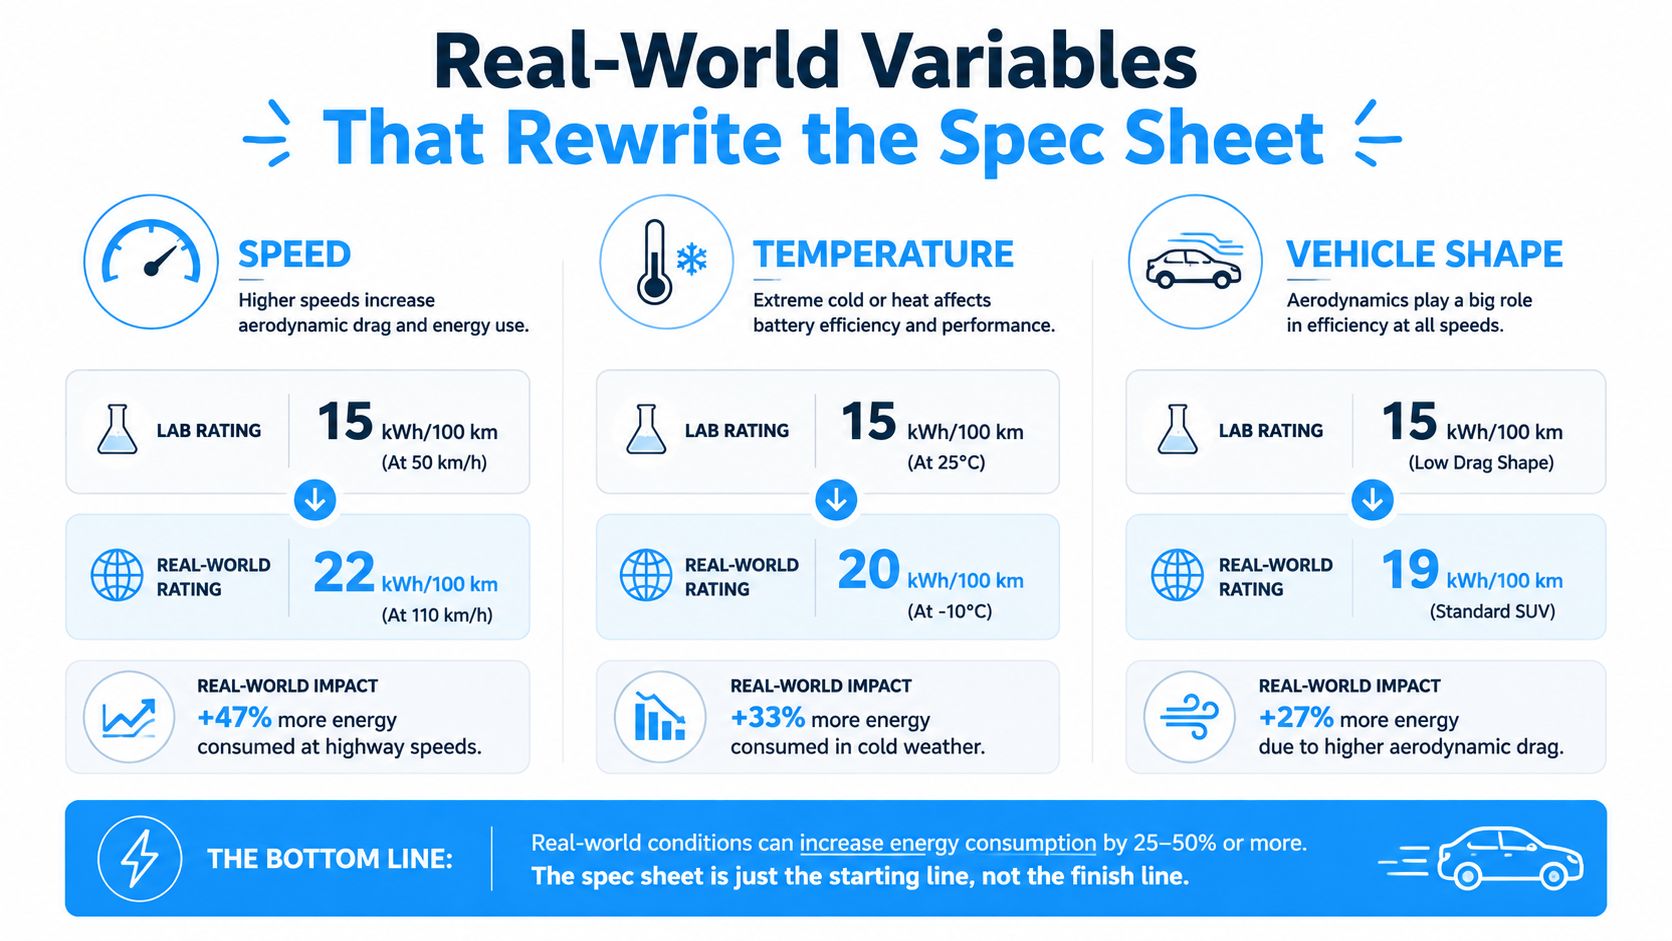
Speed changes the energy bill fastest on the open road
At higher speeds, aerodynamic drag becomes the main enemy. One EV-focused source notes that drag can account for up to 50% of total vehicle fuel consumption at highway speeds Recurrent Auto. That's why a car can feel efficient in city driving but much thirstier on a motorway, even if nothing about the battery has changed.
Stop-and-go traffic tells a different story. EVs are naturally well suited to low-speed, city-style driving because regenerative braking recovers energy that would otherwise be lost as heat. That's one reason many drivers see better efficiency in urban routes than they do on open roads.
Temperature changes how hard the car has to work
Cold weather hurts efficiency because the car must spend energy on cabin heating and battery thermal management. Heat can also reduce efficiency, but winter usually gets the stronger complaint because drivers feel the loss more directly. The practical lesson is that the same model can report very different consumption depending on season and climate-control use.
Vehicle shape completes the picture. SUVs and crossovers usually ask for more energy because they're bigger and less slippery through the air than lower, smoother-bodied cars. A sedan with similar battery tech can therefore go farther on the same charge, not because the badge is different, but because the body shape is kinder to physics.
Buyer shortcut: if your commute includes long fast-road segments or harsh winters, assume the lab number is optimistic and compare vehicles by body style, not just by battery size.
The key confusion for buyers is thinking efficiency is fixed. It isn't. It's conditional, and your route, climate, and vehicle shape decide how close you get to the advertised figure.
Efficiency, Cost, and the Charging Access Gap
The most efficient EV on paper isn't always the cheapest one to live with. Electricity cost, charging speed, and access to home or workplace charging change the equation fast, especially for drivers who can't plug in overnight. A car that sips energy but requires awkward public charging can end up less convenient than a slightly less efficient model that fits your routine better.
If you're comparing running costs, the energy price matters as much as the efficiency number. This charging cost guide is a useful companion because the same car can cost differently to run depending on where and when you charge. That's why two buyers can make opposite but equally rational choices from the same spec sheet.
Why access can matter more than efficiency
Renters, apartment dwellers, and rural drivers often face a charging access gap. If there's no reliable place to charge at home, the theoretical advantage of a very efficient vehicle shrinks because the owner has to work around public infrastructure. In dense cities, pricing transparency and curbside charging can matter more than a small efficiency difference.
The policy case for that gap is straightforward. Recent guidance from the U.S. Department of Energy's Office of Scientific and Technical Information highlights charging deserts, public charging near multifamily housing, curbside charging, and transparent pricing as priorities for underserved communities OSTI. That doesn't make efficiency less important, it just means efficiency can't fix access problems on its own.
When less efficient can still be the better choice
A slightly less efficient EV can be the right answer if it charges more conveniently, fits your parking situation, or offers bidirectional charging and backup power in a grid-prone area. The ownership value is broader than energy use alone. For some households, the ability to use the car as a power source during outages may matter more than shaving a small amount off consumption.
A car that is efficient but awkward to charge can become a daily frustration. A car that's a touch less efficient but easy to plug in may be the more practical ownership choice.
That's why total cost of ownership matters. Efficiency is one input, but convenience, infrastructure access, and charging habits decide whether that efficiency turns into real savings or just a nicer number on a listing.
How to Compare EVs on Efficiency Using Standardized Data
Start with standardized filters, not marketing copy. Look for body type, segment, efficiency, range, and long-distance rating, then compare vehicles side by side so you can see what changes when the battery, shape, and charging behavior change together. EV Stats also organizes official specs and independent-test context in one place, which helps when you're trying to compare models without juggling multiple units or test standards.
A simple shopping workflow
- Choose the body style first. A sedan, crossover, and SUV won't behave the same, so filter by the category that matches your real use.
- Compare efficiency next. Use the same unit across all vehicles, then sort by the metric that matches your driving pattern.
- Check range in context. A long range figure matters most if it fits your trip length without forcing frequent charging.
- Look at charging speed and long-distance rating. If you road trip, a strong highway profile can matter as much as lab efficiency.
- Review the side-by-side trade-offs. A lighter car may win on efficiency, while a heavier one may offer more space or convenience.
A leaderboard can help, but it shouldn't end the conversation. A high-ranking model can still be the wrong fit if it's built around the wrong body style for your commute or if its charging setup doesn't match your parking situation. The point of standardized data is not to crown a universal winner, it's to expose the trade-offs clearly enough that you can make a better personal choice.
What to prioritize by use case
City commuters should care most about efficiency, because stop-and-go driving rewards cars that waste less energy. Road-trippers should pay close attention to range plus charging speed, because the practical question becomes how fast the car can restore usable miles. Fleet buyers should weigh efficiency against duty cycle, route length, and charging access so the vehicle matches the job instead of just the spreadsheet.
If you read the numbers in that order, you'll avoid the most common trap, choosing the headline range without understanding the operating conditions behind it. Standardized comparisons don't eliminate judgment, but they make it much sharper.
Putting Efficiency at the Center of Your EV Decision
One buyer I'd trust with this decision looked at a stylish SUV, then a lighter sedan, and finally a crossover with better charging access. The SUV won on presence, the sedan won on energy use, and the crossover won on daily practicality because it fit the apartment garage and the public charger nearby. That's the point of electric vehicle efficiency, it's not just a spec, it's a system property shaped by the car, the route, and the place you live.
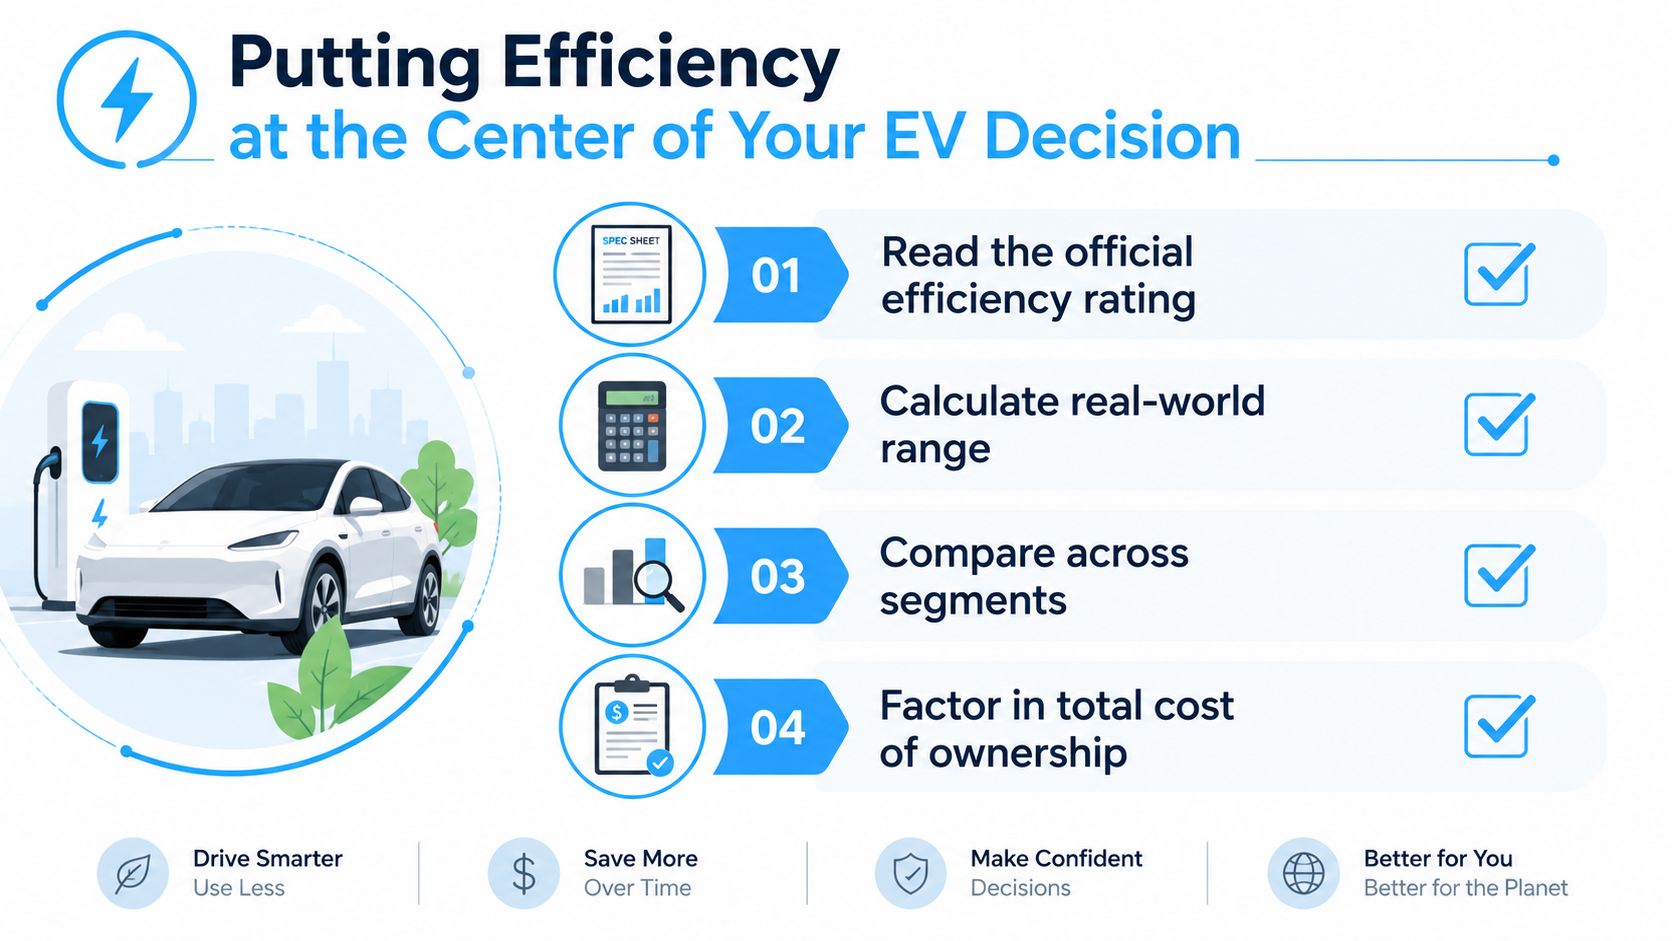
Read the official efficiency figure, then ask whether it matches your driving pattern. Check how the car behaves in cold weather, on faster roads, and in the body style you want. After that, compare total cost and charging access before you decide.
The strongest rule is simple. Efficiency matters most when it's tied to your routine, not when it's read in isolation. Better motors, better thermal management, and better charging access will keep shifting the market, but the buyer who understands the energy path from grid to wheel will keep making the better choice.
If you want a cleaner way to compare models, EV Stats brings efficiency, range, charging, and ownership tools into one database. Use it to check real-world electric car range and efficiency side by side, then test how different vehicles fit your commute, charging setup, and long-distance plans before you buy.