

In Germany, battery-electric vehicles became about 18% cheaper in real terms between 2020 and 2025, even as the average list price climbed from roughly €37,000 to €53,000 because buyers shifted toward larger, more expensive models, and global battery prices fell by 21%–24% nominally over the same stretch Fraunhofer ISI. That's the first thing a serious electric car price comparison has to confront, because sticker prices alone make EVs look more expensive than the market really is.
| Comparison lens | What it shows | Why it matters |
|---|---|---|
| Sticker price | The advertised asking price | Useful, but often misleading on its own |
| Transaction price | What buyers actually pay | Closer to reality in a market with incentives and discounts |
| Range-adjusted value | Price per mile of range | Reveals which cars are efficient buys, not just cheap badges |
| Ownership cost | Energy, maintenance, depreciation, taxes | Shows the full bill over time |
| Used-market risk | Battery health, warranty, remaining range | Helps separate bargains from expensive mistakes |
Table of Contents
- Why Electric Car Prices in 2026 Are Harder to Read Than They Look
- The Four Prices Behind Every EV Listing
- Normalising Prices Across EUR, USD and GBP
- Price Per Mile of Range and Other Value Metrics
- Why Charging Speed and Efficiency Change the Equation
- Incentives, Taxes and Total Cost of Ownership
- The Used-EV Shift That Changes the Best-Value Answer
- Choosing the Right Comparison Strategy for Your Buyer Profile
Why Electric Car Prices in 2026 Are Harder to Read Than They Look
The headline number can point in the wrong direction. In the U.S., Kelley Blue Book reported the average new EV transaction price at $57,245 in August 2026, while the average for all cars was $49,077 Kelley Blue Book. That gap looks simple on the surface, but it sits inside a market with larger batteries, bigger crossovers, and more higher-trim models than a few years ago.
Why averages moved while affordability improved
Average list price is not the same thing as market affordability. In Germany, the list price average rose from about €37,000 to €53,000 between 2020 and 2025, while battery-electric vehicle prices fell by about 18% as the market mix moved toward more expensive models Fraunhofer ISI. A quick look at the list-price trend would miss the fact that buyers were getting more car for the money in many parts of the market.
That is why a serious comparison has to separate market mix from true value. A compact EV and a premium SUV can both count as electric cars, but they do not belong in the same pricing story. Even within the same brand, the cheapest version and the volume seller can sit in very different economic worlds.
Practical rule: compare EVs by the class you would actually buy, not by the whole market average. Otherwise, the premium end drags the numbers upward and makes mainstream options look worse than they are.
What this means for buyers right now
For shoppers, the question is not “Are EVs cheaper than before?” It is “Which EVs are cheaper for the range, equipment, and charging behavior I need?” That is a harder question, but it is the only one that gives a fair answer. A raw MSRP list cannot tell you whether a $53,000 EV is expensive or a strong value if it also delivers unusually good range, fast charging, or a lower effective ownership cost.
The rest of this comparison starts from that point. Every number matters more once it is normalized, because a price tag without context is only a starting point.
The Four Prices Behind Every EV Listing
A lot of EV listings look inconsistent because they are showing different price layers, not because the data is wrong. One site may show a base MSRP, another may show a typical transaction price, and a third may point to a loaded trim that includes options most buyers will not choose. That is why the same car can appear to cost three different amounts on three different pages.
MSRP, transaction price, trim stack, and effective price
MSRP is the advertised starting point. Transaction price is what a buyer pays after dealer discounting or add-ons are negotiated. Trim-stack price reflects the way many shoppers move past the base car and pick mid trims for features, wheels, safety tech, or better charging hardware. Effective post-incentive price is the amount left after country-specific credits, rebates, tax treatment, or lease structures.
The spread between those layers can be wide. Edmunds found that in Q1 2026 the average fully electric model started at $53,048, compared with $35,722 for a gas compact crossover, a 42% average price gap overall and a 58.5% gap in compact SUVs, while Kelley Blue Book reported the average U.S. new EV transaction price at $57,245 Kelley Blue Book. That does not mean every EV is overpriced. It means the market still carries a premium at the point of sale, and the gap becomes clearer once you separate list price from what buyers pay.
| Price Layer in a Typical EV Listing | U.S. USD Example | Germany EUR Example | U.K. GBP Example |
|---|---|---|---|
| Base MSRP | Starting number on the spec sheet | Starting number on the spec sheet | Starting number on the spec sheet |
| Mid trim | Higher equipment, better wheels, more tech | Higher equipment, better wheels, more tech | Higher equipment, better wheels, more tech |
| Loaded trim | Options, premium audio, upgraded driver assistance | Options, premium audio, upgraded driver assistance | Options, premium audio, upgraded driver assistance |
| Effective price | After incentives, rebates, taxes, and dealer terms | After incentives, rebates, VAT treatment, and dealer terms | After incentives, tax treatment, and dealer terms |
Why the same model appears at different prices
The spread is often a trim strategy problem. A base EV may look affordable on paper, then a buyer adds the package that gets usable range, better infotainment, or faster charging and the number moves up quickly. That is normal, but it makes direct comparison close to useless unless you compare like with like.
A mid-size EV with three trims can look affordable at entry level and expensive at the top end without any contradiction. The base version may be the headline, the middle trim may be the volume seller, and the top trim may be the one reviewers mention because it is the most visible. Buyers who compare only the lowest advertised price end up benchmarking a car they probably will not buy.
The practical comparison is the trim level that sells, then the effective price after incentives and local taxes. That is the point where a list price starts to reflect a real buying decision instead of a brochure headline.
A good comparison starts by asking which trim the market really buys, not which trim the brochure advertises first.
Normalising Prices Across EUR, USD and GBP
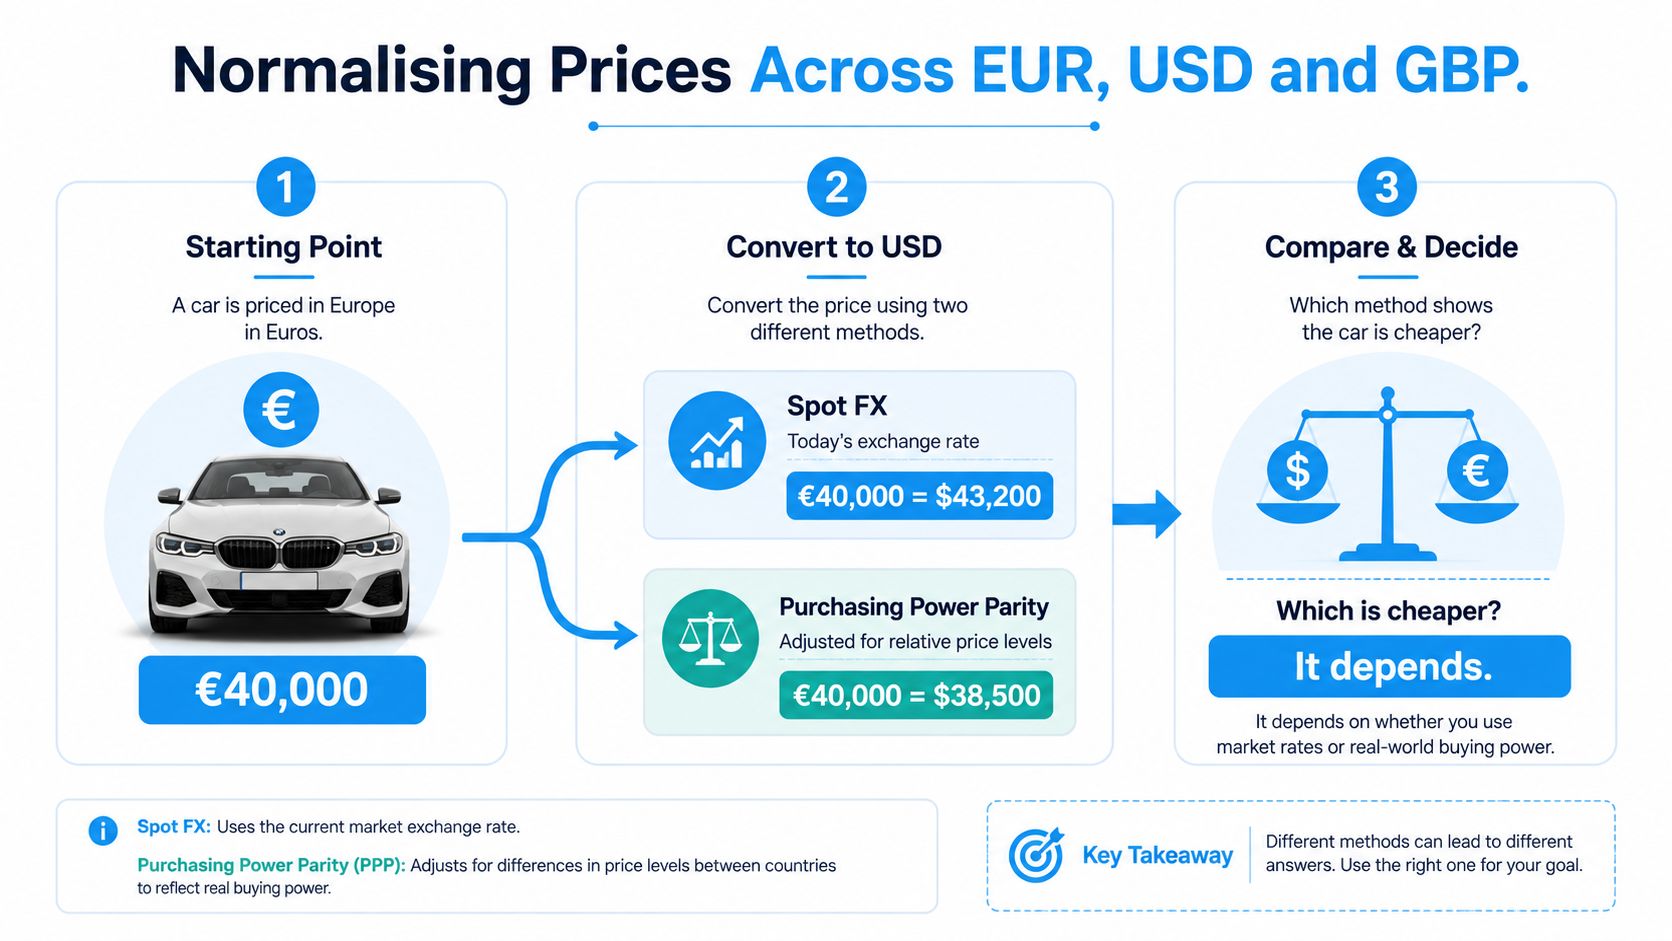
Cross-border price comparisons fail when people treat currency symbols as if they were all on the same footing. A €40,000 car is not automatically cheaper than a $45,000 car, because the exchange rate changes, VAT treatment differs, and list prices may or may not include local taxes. The numbers need a common frame before they mean anything.
Spot FX versus purchasing power parity
Use spot FX when you want a direct financial conversion at today's market rate. Use purchasing power parity when you want a rougher sense of local affordability. Those two methods can point to different conclusions, and neither is “wrong” on its own.
A simple worked example is enough to show the problem. If a car is listed at €40,000, a spot-FX conversion might land around $43,200, while a purchasing-power approach could suggest something closer to $38,500 in adjusted terms. The precise answer depends on method and market context, not on the badge on the bonnet. The key point is that the same car can look cheaper or more expensive depending on how you normalize it.
What to check before you compare countries
A practical cross-border checklist helps more than a raw currency table:
- Check whether local VAT or sales tax is included: One country's “list price” can already include tax while another's doesn't.
- Compare the same trim and battery size: A base model in one market may correspond to a mid trim elsewhere.
- Watch for indicative pricing: Some manufacturer figures are estimates, not final retail offers.
- Convert only after aligning incentives: Pre-incentive and post-incentive numbers should never be mixed casually.
- Use one time point for FX: Comparing prices across different exchange dates can distort the result.
The best rule is simple. Convert the price, then compare the configuration, then adjust for local tax treatment. If you reverse that order, you'll often end up comparing two cars that only look equivalent on paper.
Price Per Mile of Range and Other Value Metrics
A sticker price becomes more useful when you divide it by usable driving range. Price per mile of range does exactly that, and it gives a clearer read on value than MSRP alone. A car that looks cheaper on the window sticker can end up costing more for each mile it delivers.
The range comparison framework helps here because range-normalized pricing often points to a different ranking than headline price.
A side-by-side range comparison
| Model | U.S. MSRP (USD) | Range (mi) | Price Per Mile (USD) |
|---|---|---|---|
| Lucid Air Pure | 69,900 | 420 | 166 |
| BMW i4 eDrive40 | 57,900 | 318 | 182 |
| Audi S e-tron GT | 125,500 | 300 | 418 |
| Ford Mustang Mach-E Premium | 39,995 | 300 | 133 |
| Cadillac Escalade IQ | 127,700 | 460 | 278 |
The table shows a result that is easy to miss in raw pricing. The Lucid Air Pure costs more than the BMW i4 eDrive40, yet its range-adjusted figure is lower in this comparison. At the premium end, the Audi S e-tron GT costs far more per mile of range than a more efficient sedan, which is exactly why a simple sticker-price shortlist can be misleading Coltura.
Why price per mile beats headline MSRP for shortlists
Raw MSRP favors cheaper cars with limited range and penalizes expensive cars with more usable distance. That works if the only question is how much cash leaves your account on day one. It falls short once you start comparing what each car gives back in driving distance.
A buyer shortlisting EVs should calculate this figure for every model under consideration. The formula is straightforward, MSRP divided by range. If two cars land close on price per mile, the next step is to compare efficiency, charging speed, and trim content rather than stopping at the sticker.
Best takeaway: a cheaper EV is not automatically the better-value EV. Range-adjusted pricing often rewards the car that costs more upfront but delivers more usable distance per dollar.
A note on battery-cost thinking
Price per mile is close to a consumer-friendly value metric, but it is not the same as battery economics. Battery size, chemistry, and packaging still shape vehicle cost, yet those inputs do not directly tell a buyer what the car is worth on the road.
That is why range-normalized pricing works better for public comparison. It focuses on the output that matters to a driver, not just the hidden bill of materials behind the badge.
Why Charging Speed and Efficiency Change the Equation
Two EVs can look similar on price per mile and still feel very different to live with. One might top up fast and make road trips easier. The other might squeeze more miles from each kilowatt-hour and lower energy costs over time. Both metrics matter, and neither can be ignored if you drive a lot.
Charging behavior matters as much as range, because trip time and energy use change the cost of ownership in daily life.
Fast charging and energy economy pull in opposite directions
A U.S. comparison shows the Hyundai Ioniq 5 N at 18 minutes for 20 to 80% charging and 2.9 mi/kWh, the Mercedes-Benz EQS Saloon at 31 minutes and 3.7 mi/kWh, and the Tesla Model S at 28 minutes and 3.6 mi/kWh Alibaba buying guide. That set of numbers makes the trade-off obvious. The Ioniq 5 N gives up efficiency for faster DC top-ups, while the EQS and Model S use energy more efficiently but spend longer at the charger.
That difference matters most for people who do long trips or high annual mileage. If you charge mostly at home and drive a moderate daily distance, efficiency usually wins. If you depend on public fast charging, session length starts to matter more than the last decimal point of consumption.
How to think about time value
You can think of charging speed as a time cost. Every extra minute at a fast charger is a delay, and for some drivers that delay matters more than a small efficiency gain. A sedan that's slightly more efficient but slower to charge may still be the better commuter car, while a crossover that top-ups quickly may be the better road-trip tool.
The right question is not which metric is best. It's which metric reflects how you use the car. A city driver with reliable home charging should weight efficiency heavily. A sales rep crossing motorways every week should care more about charging curve and session length. Those two buyers would not choose the same winner, even if they started from the same list price.
Incentives, Taxes and Total Cost of Ownership
List price is only the front door. What leaves your account depends on incentives, tax treatment, road tax, insurance, and the energy you will spend over the life of the car. A serious EV comparison has to move beyond the showroom number and into total cost of ownership.
Country-specific adjustments
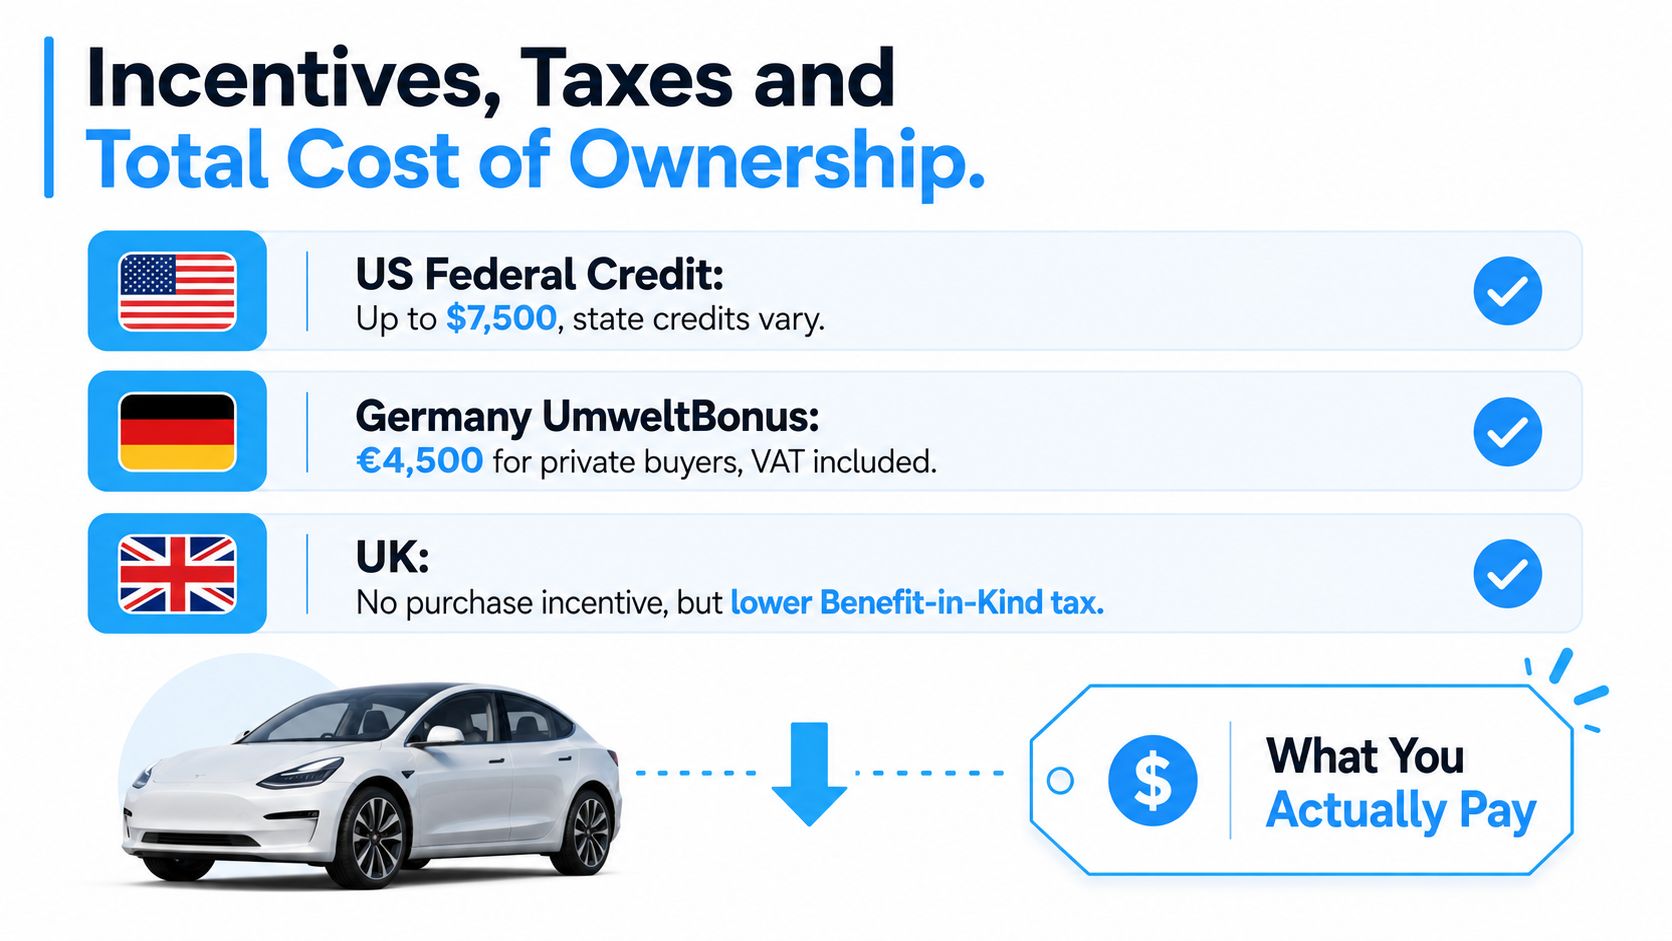
In the U.S., the federal credit structure has changed, so buyers should not assume a blanket incentive is available on every vehicle. In Germany, VAT treatment and the old Umweltbonus framework can affect the buyer's effective cost. In the U.K., the comparison often leans more heavily on tax treatment and company-car rules than on a purchase grant.
That country split matters because two buyers can look at the same EV and pay very different effective prices. A list price may be identical in one brochure, but the final bill can shift once taxes and local incentives are folded in. Fleet buyers and private buyers should not use the same comparison template.
What belongs in a TCO check
A practical ownership calculation should include:
- Energy cost: what you will spend to drive your mileage pattern.
- Maintenance: fewer moving parts do not mean zero cost.
- Depreciation: the biggest swing factor for many buyers.
- Insurance: often ignored, but it can change the monthly picture.
- Road tax or BIK treatment: especially relevant in the U.K. and fleet contexts.
That list is more useful than chasing one “real price” number, because it reflects the way ownership works. A car with a higher sticker price can still be the cheaper car to own if it depreciates more slowly or costs less to energize and maintain. The reverse is also true.
You can model these figures yourself using the EV cost savings calculator, which breaks down energy, maintenance, and depreciation by your specific mileage and charging habits.
How to use the comparison in practice
Start with the listing price, then subtract any incentive you qualify for, then add ownership costs that match your mileage and charging situation. Run the same method for each contender, because the gap between models often changes once taxes and running costs are included. A clean spreadsheet beats a glossy brochure every time.
The Used-EV Shift That Changes the Best-Value Answer
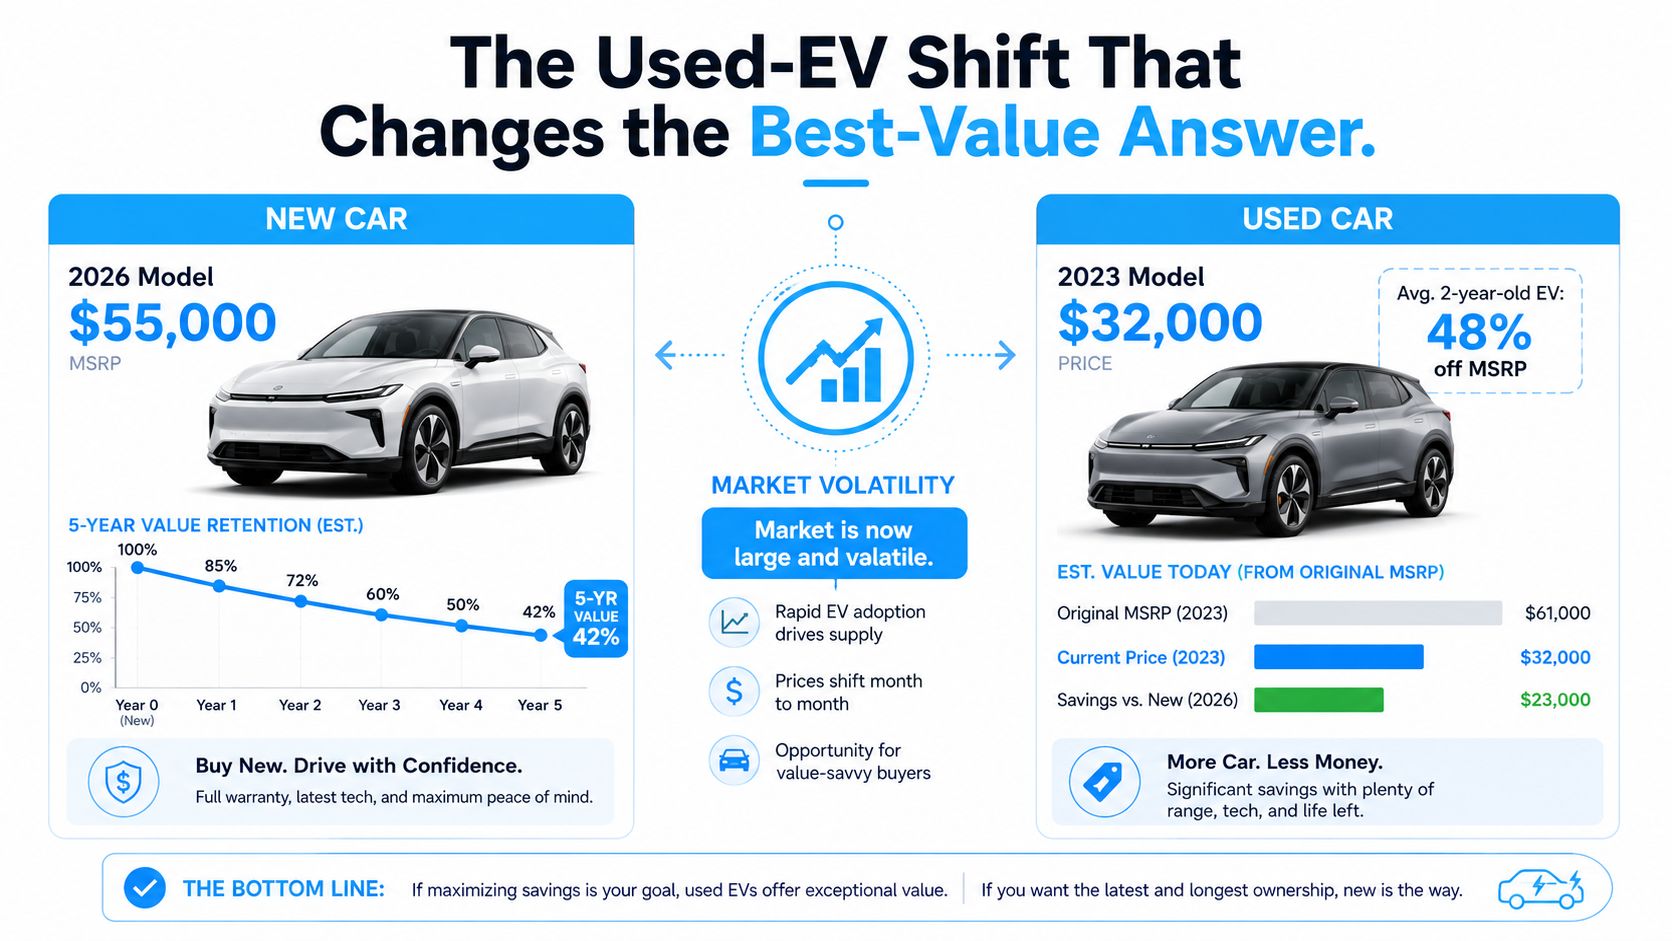
The cheapest new EV is not always the smartest buy. The used market now deserves its own comparison logic because battery health, warranty coverage, and depreciation can change the value of a car more than the badge or mileage reading does.
Recurrent's used-EV research highlights that the used market is large enough to need separate analysis, and that's exactly why a value-focused comparison can't stop at new-car MSRP.
The checks that matter before you buy used
Battery condition comes first. Remaining warranty coverage comes second. Remaining range comes third. Those three factors determine whether a low sticker price is a bargain or just a cheap entry into a future repair problem.
Older policy research from the ICCT also showed that purchase-price parity arrives on different timelines depending on range segment, with shorter-range models reaching parity earlier than longer-range vehicles. That helps explain why used values can diverge so much by segment. A small commuter EV, a midsize crossover, and a premium sedan do not depreciate on the same curve.
Why depreciation changes the answer
A two-year-old EV can be the best value when the biggest depreciation hit is already behind it. That doesn't make every used EV a deal. It does mean the buyer who verifies battery health and warranty status may get more range per dollar than someone buying new.
Risk rule: if the seller can't document battery health, treat the price as incomplete. A cheap used EV with uncertain range is not a bargain, it's an unknown.
What comparison pages usually miss
Most price comparison pages focus on the new-car angle and stop there. That leaves out the market where many value buyers shop. A used EV with verified health can deliver a better value proposition than a new base model, especially once depreciation and trim inflation are accounted for. The problem isn't that new-car comparisons are wrong. It's that they're incomplete.
Choosing the Right Comparison Strategy for Your Buyer Profile
The strongest comparison method starts with the buyer, not the badge on the car. A first-time commuter, a fleet manager, and a family replacing a second car are solving different problems, so their scorecards should weight mileage, charging access, and risk in different ways. The most useful EV price comparison aligns with the buyer's actual use case rather than ranking models by spreadsheet length.
For a first-time commuter in the U.S., the most relevant figures are transaction price, range per dollar, and efficiency. Home charging changes the equation because most daily energy comes from a plug the driver controls, so charging session speed matters less than it does for long-distance users. In practice, a mainstream EV with a sensible trim and a strong range-per-dollar figure often makes more sense than a premium model with impressive headline specs.
A German fleet manager should start with effective price after tax treatment, then look at depreciation, then at charging speed and energy economy. Company-car rules can change the economics quickly, and fleet duty exposes weak uptime or poor charging behavior more clearly than private use. The better choice is often the model that fits policy, mileage, and residual-value assumptions cleanly, even if its sticker price is not the lowest in the set.
A U.K. family replacing a second car has a different set of priorities. Used-EV risk, home charging access, and running costs deserve more weight than range bragging rights, especially if the car only covers school runs, commuting, and local errands. In that profile, a used model with a documented battery record and manageable insurance can be the better value than a longer-range vehicle that does more than the household needs.
Across those profiles, the comparison method stays the same. Start with the number you will pay, normalise it by range, then add charging speed, taxes, and used-market risk. A buyer who looks at price per mile of range and then checks battery-related risk will usually get a clearer answer than one who stops at the sticker. That is the comparison that matters.