

A Tesla Model 3 added 205 km in 15 minutes in a 2025 winter charging study, while the Kia Niro EV added 35 km and the Toyota bZ4X only 19 km under the same broad real-world comparison conditions, as reported by the BCAA and CAA winter EV performance study. That spread is the central problem with most EV charging speed comparisons. A headline such as “250 kW” describes a ceiling, not the amount of usable highway range your car will restore before you leave the stall.
A better EV charging speed comparison starts with range added per minute, supported by the vehicle's charging curve, battery temperature, state of charge, and energy consumption. AC charging still matters for home and workplace use, while DC charging determines how quickly an EV can recover from a long highway leg. The fastest-looking vehicle on a specification sheet may not be the fastest choice for your actual route.
Table of Contents
- What Charging Speed Actually Means in Real Life
- AC and DC Charging Standards Compared
- Peak kW Versus Sustained Speed on the Curve
- How Current EVs Perform at the Plug
- Charging Speed and Trip Planning on the Road
- Speed, Battery Health, and Long-Term Cost
- Which Charging Speed Should You Prioritize
- Decision Checklist and What Comes Next
What Charging Speed Actually Means in Real Life
You arrive at a highway station with the battery at 10% and connect to a 350 kW stall. The screen briefly shows 262 kW. After fifteen minutes, the car has restored roughly 180 km of range. That is a useful result, but the number on the display doesn't tell the whole story.
Peak charging rate is the highest momentary power the vehicle accepts, measured in kilowatts. Effective charging speed is the average amount of usable range restored per minute across the part of the session you need. The first figure is easy to advertise. The second determines when you can rejoin the highway.
Three numbers describe one charging stop
A charger may be rated for a particular output, but the car decides how much power it can accept at that instant. The battery management system adjusts the request as the battery fills, and the station supplies power within its own limits. ChargePoint explains that modern DC charging standards have moved from early systems around 50 kW toward high-power charging in the 250 to 350 kW range, with some standards supporting up to 500 kW depending on the vehicle and station, in its connector and charging standards guide.
That creates three separate values:
- Station capability: the maximum power the equipment can provide.
- Vehicle acceptance: the maximum power the car can draw under current conditions.
- Session average: the power sustained while energy moves into the battery.
The session average matters because charging power usually falls as state of charge rises. Cold cells may also accept less power until the pack reaches a suitable temperature. A driver who stops at 10% and leaves near 60% can experience a much better average than someone who stays connected toward 80% and beyond.
Practical rule: Compare the range your EV adds during the minutes you spend parked, not the largest kW number that appears for a moment.
AC and DC serve different jobs. A home wallbox can refill the battery while the car is parked overnight, whereas DC fast charging is designed for corridor travel and short roadside stops. The emerging ultra-fast tier above 300 kW can reduce those stops further, but only when the vehicle, battery, connector, and station work together.
AC and DC Charging Standards Compared
AC and DC charging differ at the point where electricity becomes battery-ready. With AC charging, alternating current reaches the vehicle and the onboard charger converts it. DC fast charging completes that conversion at the station, then sends direct current to the battery. The result is a higher potential charging rate, although the vehicle still controls how much power it accepts.
EV Charging Standards at a Glance
| Standard | Type | Voltage Window | Max Power | Typical Use |
|---|---|---|---|---|
| Type 2 | AC | Varies by installation and vehicle | Up to 22 kW in common AC applications | Home, workplace, and public AC charging |
| J1772 | AC | Varies by installation and vehicle | Commonly used for Level 1 and Level 2 charging | Home and workplace charging, mainly North America |
| CCS2 | AC and DC | Up to high-voltage DC systems | Described as 3.7 kW to 500 kW depending on configuration | Combined AC and high-power public charging |
| NACS | AC and DC | Varies by vehicle and station | Depends on vehicle and deployment | North American home, public, and fast charging |
| CHAdeMO | DC | Early specification at 500 V, later versions up to 1 kV | From 62.5 kW in its first generation to as much as 400 kW in later versions | Legacy Japanese EV fleets and compatible stations |
For the relationship between charging levels, equipment, and daily driving, see this guide to EV charging levels.
Why voltage changes the hardware equation
Power is the product of voltage and current. At the same power level, a higher-voltage battery needs less current to move the same energy. That reduces the electrical load on cables and connectors, helping explain why 800-volt architectures can support charging above 300 kW when the station and vehicle are built for it.
Voltage alone does not determine the result. Cooling capacity, battery controls, cell temperature, and state of charge all affect the power accepted during a session. A vehicle with a high-voltage platform may still reduce charging power when the pack is cold, near a high state of charge, or approaching a thermal limit.
Infrastructure labels therefore describe an upper boundary, not the range restored per minute. A 7 kW home wallbox fits routine overnight charging, while 22 kW three-phase AC can help where the vehicle accepts that rate. Older public DC sites may provide 50 kW, highway locations often offer 150 kW, and premium hubs may list 350 to 500 kW. Two vehicles rated for the same station output can still add very different usable range because their batteries, efficiency, and charging controls differ. As documented in the BCAA and CAA winter study, real conditions can widen that gap further.
Peak kW Versus Sustained Speed on the Curve
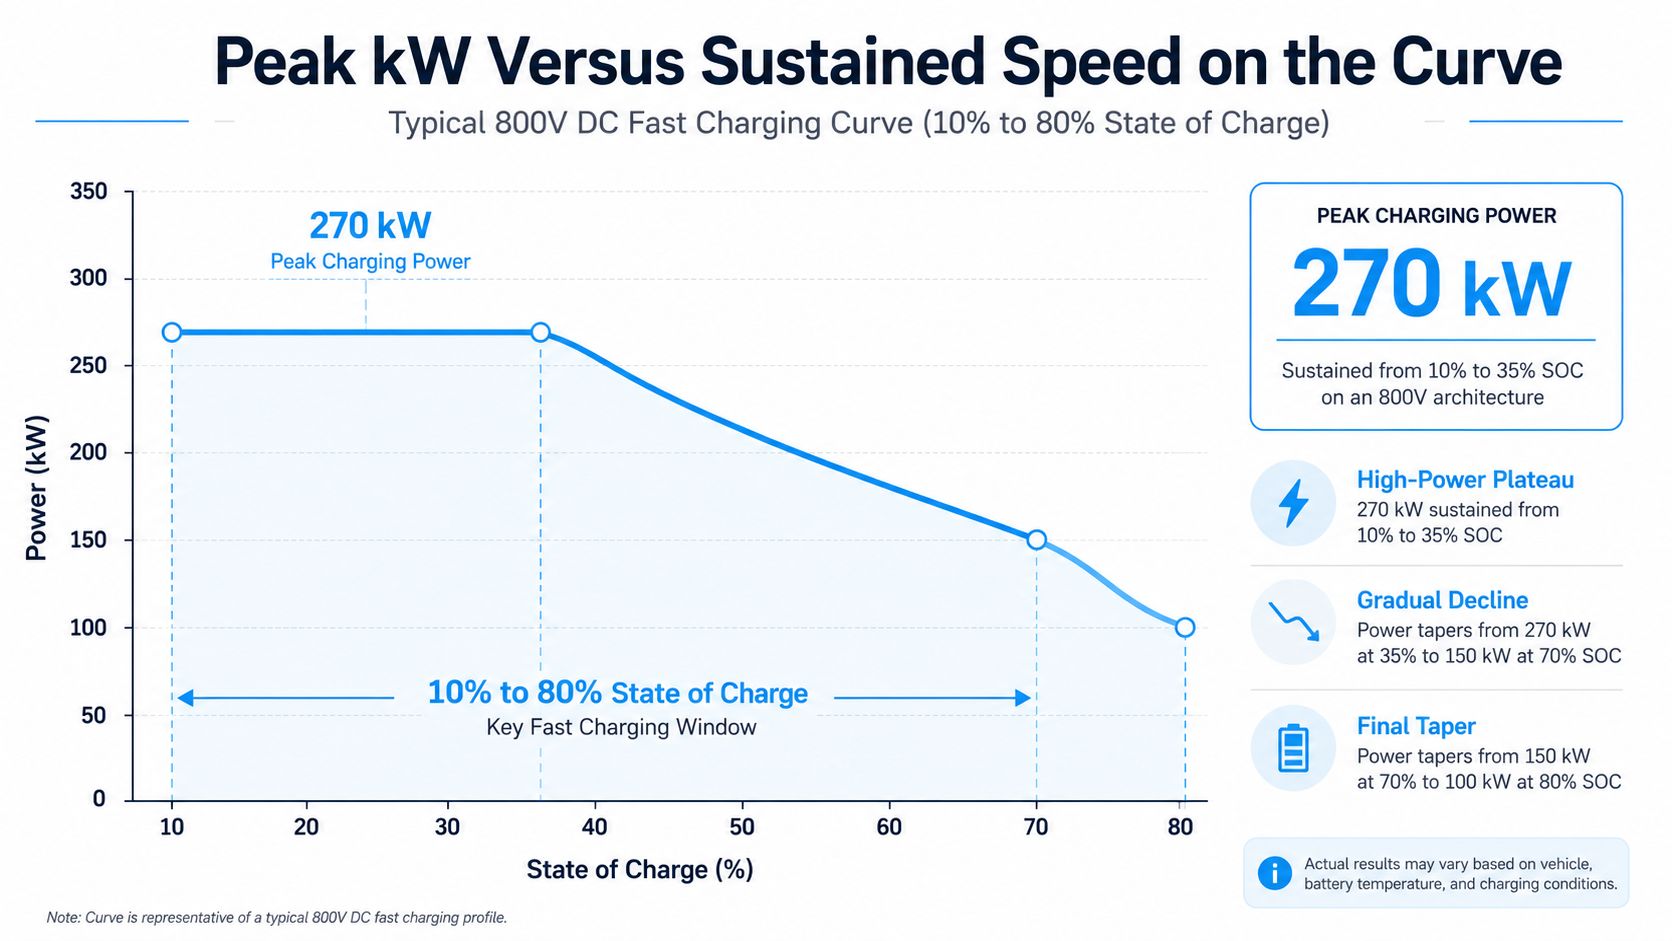
A 10% to 80% state-of-charge window offers a practical basis for comparing charging curves. It captures the productive middle of a session without giving excessive weight to the slow final stretch. The U.S. Department of Transportation describes DC fast charging as taking a BEV to 80% in about 20 minutes to 1 hour. Independent comparisons show a similarly wide range, from about 18 minutes for the Hyundai Ioniq 5 and Kia EV6 class to roughly 45 minutes for lower-power models such as the Ford Mustang Mach-E. The DOT guidance provides the broader context.
Read the curve, not only the crest
A typical high-voltage curve may hold close to 270 kW early in the session, then decline through the middle state-of-charge range and taper more sharply near 80%. A 400-volt rival may start at a lower peak and reduce power sooner. The area under each curve matters more than the opening value because it determines how much energy reaches the battery during the stop.
Peak kW is only a snapshot. Average kW describes energy delivered across a selected window, while kWh per minute connects that energy to the battery. For a driver, kilometers or miles restored per minute is often the clearest measure. It reflects usable battery capacity and vehicle efficiency, translating charger output into additional road range.
Edmunds describes its EV charging test as an apples-to-apples comparison of how quickly different EVs add range at a fast charger. Consumer Reports also notes that several recent EVs exceed 12 miles of range per minute under ideal DC fast-charging conditions, typically on 350 kW equipment, as summarized in the Edmunds EV charging coverage. The same charger can therefore produce sharply different trip results across vehicles.
What controls the decline
Thermal management is a major control point. A battery may accept high power only within a defined temperature range, then reduce intake as heat accumulates. Battery chemistry, pack size, cell arrangement, and software calibration shape the curve as well.
A larger battery can absorb substantial energy while showing only a moderate percentage increase. A smaller, efficient vehicle may restore more driving range per minute even when its displayed kW is lower. That is why a useful EV charging speed comparison records the full curve and calculates usable range restored, rather than ranking vehicles by their initial peak. Two EVs rated at 250 kW can therefore produce very different outcomes at the same stop, depending on how long they sustain power and how efficiently they turn stored energy into distance.
How Current EVs Perform at the Plug
Independent testing shows why advertised charging capability is an incomplete measure. The more useful output is range restored during a fixed charging interval, because it captures efficiency, battery controls, temperature response, and tapering in one result. Two EVs rated at 250 kW can therefore deliver very different minutes-per-stop and trip outcomes.
Winter testing makes the gap clear. In the 2025 study, the Tesla Model 3 added 205 km in 15 minutes, compared with 35 km for the Kia Niro EV and 19 km for the Toyota bZ4X, according to the BCAA winter EV performance findings. The Tesla result does not establish a universal winner across routes or climates. It shows that a shared category label, such as mainstream DC-fast-charge EV, can conceal a major difference in usable range recovery.
Why a single model table can mislead
A table of peak kW, average kW, and session time appears precise only when test conditions match. The available evidence does not provide a standardized model-by-model dataset covering every vehicle, ambient temperature, architecture class, and metric. Filling those gaps with inferred medians would create false precision.
A defensible comparison keeps the findings tied to the measured conditions:
- Tesla Model 3: Strong winter range restoration in the cited test, expressed as kilometers added rather than peak power alone.
- Kia Niro EV: Much lower range recovery in the same winter comparison, despite its place in the DC-fast-charging market.
- Toyota bZ4X: The lowest of the three cited results in that study.
- Audi A6 e-tron Performance: Added 186.1 miles in 20 minutes in recent winter highway testing, ahead of a Tesla Model Y AWD at 120.6 miles, as reported in the same BCAA and CAA testing source.
The last comparison adds an important qualification. Vehicles with strong charging reputations can still produce different highway results when temperature, speed, route conditions, and usable range are normalized differently. A peak-power ranking misses those interactions.
For model-level curve work, the fastest EV charging comparison works best as a starting point, not a final verdict. Check whether each quoted result represents peak power, a 10 to 80% session, a fixed-minute range test, or a full-route measurement. The relevant question is how much usable range returns before the driver leaves the charger.
Charging Speed and Trip Planning on the Road
250 kW describes a charger's possible output, not the time a driver saves. Route value comes from usable range restored per minute, after accounting for consumption, weather, traffic, battery size, and arrival state of charge. A vehicle with a controlled high-power curve may complete a long journey with fewer, shorter stops than one with a higher peak that tapers quickly.
The practical question is simple: how much route-ready range returns before leaving the charger? A 600-mile route can reveal differences hidden by a short charging session. A 50 kW-only vehicle may require longer recovery periods, while a more efficient vehicle can cover the same distance with less energy and less charging time. Route models should therefore use measured range added, not charger labels alone.
A practical route method
Use this sequence before comparing vehicles:
- Set the arrival buffer. Plan to reach a DC charger with roughly 10% to 20% state of charge when route conditions allow. Starting low gives the vehicle access to the stronger early portion of the curve, but the buffer must reflect charger reliability and the next station's distance.
- Measure the stop by range gained. Record miles or kilometers added during the time you spend plugged in. This captures efficiency and tapering together.
- Count detours and queues. A nearby lower-power stall can be faster overall than a distant premium charger or an occupied 350 kW unit.
- Precondition before arrival. In cold weather, battery preparation can materially improve the opening part of the session. The car needs to know the destination charger early enough to heat the pack.
A 150 kW vehicle can suit a driver who stops during meals and rarely travels long distances. A high-voltage vehicle with a flatter curve better fits short highway pauses. The lower-rated vehicle is not automatically inferior, and the higher-rated vehicle still requires route planning.
The Edmunds charging test methodology supports using added range as the common denominator. Compare the time required to restore the range a route consumes, rather than the time needed to fill an arbitrary percentage of batteries with different usable capacities. Public charging references from the U.S. Department of Transportation also frame stops around practical dwell times, from about 20 minutes to an hour, making recovered route range more useful than peak kW alone.
Speed, Battery Health, and Long-Term Cost
Charging speed shapes ownership through downtime, battery management, and residual value. The evidence does not support assigning every EV a fixed degradation penalty for frequent fast charging. Battery chemistry, cooling hardware, software limits, climate, and charging habits all influence the result.
The practical distinction is thermal load. Repeated high-power DC sessions generally place greater electrical and heat demands on the pack than routine AC charging. That makes cooling capacity and charging controls more important than the peak figure alone. An EV rated at 250 kW may restore less usable range per minute than a lower-rated model with a flatter curve, especially after the battery reaches operating limits.
Battery health also affects charging speed over time. As the pack ages, software may limit available power or usable capacity, changing both session length and route range. Drivers should therefore evaluate charging performance as a long-term curve, not a single result from a new vehicle.
Downtime has an operational price
For a private driver, a few extra minutes may be an inconvenience. For a fleet, repeated delays reduce vehicle availability, driver productivity, and scheduling flexibility. The ownership calculation should include the time the vehicle is unavailable, not only the electricity consumed.
A fleet manager should examine:
- Energy recovered per stop: How much route-ready range returns during the planned dwell time?
- Repeatability: Does the vehicle deliver similar results after several highway legs?
- Thermal response: Does useful power continue as the battery warms, or does the curve fall early?
- Infrastructure fit: Can the depot or public route supply the power the vehicle accepts?
An 800-volt design can reduce current at a given power level, but voltage alone does not guarantee lower degradation or operating cost. Preconditioning and active thermal management may help the vehicle reach its intended curve. The battery management system still determines the actual power request.
Use total ownership evidence, not a fear-based rule
The EV battery degradation analysis should be considered with the manufacturer's warranty terms and the vehicle's battery-control strategy. Buyers should check how the warranty defines capacity loss, which conditions trigger power reduction, and whether the car offers a clear preconditioning function.
The financial conclusion is direct: charging speed is a dollar-per-mile decision when time has business value. A private owner may prefer a lower purchase price and dependable AC charging. A high-utilization operator may justify an EV with a stronger sustained curve because predictable stops support tighter schedules. Paying for a peak rate makes less sense when the route, charger network, or battery temperature rarely permits access to it.
Which Charging Speed Should You Prioritize
The right charging specification depends on the week you drive. A commuter with dependable home charging may gain little from an expensive ultra-high-power system, while a long-distance driver without home access may treat DC performance as a primary ownership feature. Peak kW alone misses the more useful question: how much usable highway range returns for each minute connected?
Buyer Profile to Charging Speed Priority
| Driver Profile | Daily Mileage | Min DC Peak | Min AC Rate |
|---|---|---|---|
| Urban commuter with home charging | Qualitative assessment based on routine use | Modest DC capability may be sufficient | Around 7 kW can suit overnight charging |
| Workplace and home charging user | Qualitative assessment based on parking time | Moderate DC capability for occasional trips | Higher AC rate helps when parking windows are shorter |
| Frequent highway traveler | Qualitative assessment based on route length | Prioritize a sustained curve above 150 kW where available | Strong AC capability remains useful between trips |
| Fleet or rideshare vehicle | Qualitative assessment based on utilization | Prioritize repeatable high-power sessions and uptime | Depot rate should match shift turnover |
| Apartment resident without private charging | Qualitative assessment based on access to public sites | Prioritize reliable DC performance and network coverage | Workplace or public AC access becomes important |
These rows define decision categories, not guaranteed results. Compare each vehicle's 10 to 80% time, charging curve, and measured range recovery. A car rated at 250 kW may restore less usable range per minute than another with the same rating if it reaches its peak briefly and then reduces power sharply.
Match the car to the worst week
For an owner charging at 7 kW, a flat high-power DC curve may be used only on occasional trips. A household with a higher-power wallbox can restore more energy during a short parking window, but the car must support that AC input for the hardware to matter. Do not confuse the wallbox rating with the vehicle's onboard charging limit.
Long-distance drivers should compare how long an EV sustains useful power above the middle of the curve. The best candidate may not have the highest peak. A vehicle that adds more highway range per minute can finish a route sooner even when another model displays a larger number at the start. Measured road-trip sessions and repeat tests, such as the methodology described by Edmunds' EV charging tests, provide better buying evidence than the headline specification alone.
Fleet buyers need a different filter. Model shift timing, charger occupancy, queue risk, and the cost of taking a vehicle out of service. A lower-cost EV with slow DC recovery can become expensive if it repeatedly misses operating windows, even when its purchase price and rated range appear attractive.
Choose the EV whose charging curve fits your worst week, not your best one.
Some buyers should ignore 350 kW capability entirely. If home charging covers normal use and road trips include long meal stops, paying for a premium charging platform may not improve daily life. Others should reject a model with a weak curve, because every long trip will repeat the same time penalty. Prioritize the charging behavior that matches your least convenient routine, not the highest number on the specification sheet.
Decision Checklist and What Comes Next
Use these checks before treating a charging specification as a buying reason:
- Confirm your real weekly route. Include motorway speed, winter conditions, regular destinations, and practical stopping points.
- Identify the lowest-power DC site you will use. Performance at a premium hub does not remove the delay created by slower infrastructure on a regular route.
- Check 10 to 80% time, not peak kW. As noted earlier, the U.S. Department of Transportation's broad 20-minute to 1-hour range for DC fast charging shows why session duration needs context.
- Validate battery preconditioning. Confirm how the vehicle prepares the pack and whether navigation can trigger that preparation before arrival.
- Confirm the connector and standard. CCS, NACS, CHAdeMO, Type 2, and J1772 access vary by region, model, and station.
- Test home circuit capacity. A wallbox must fit the property's electrical capacity and the vehicle's onboard AC acceptance.
- Review ownership cost over your planning horizon. Include energy, maintenance, depreciation, charging equipment, and the value of driver or vehicle time.
What the next infrastructure wave changes
Charging infrastructure is moving toward 350 to 500 kW equipment, but higher station output matters only when a vehicle can sustain that input and the driver can access an available stall. Heavy-duty transport may eventually use the Megawatt Charging System, while passenger EVs continue refining 800-volt platforms and software-controlled curves.
The useful comparison is no longer which EV posts the largest peak. It is which vehicle restores the most route-ready range per minute under the buyer's temperature, speed, charger, and state-of-charge conditions. That measure connects the charging curve to the outcome that matters on a trip: how much usable distance returns before the driver leaves.
Pull a PlugShare report for your three most important charging stops, recording available power and reliability. Then compare candidate EVs by 10 to 80% time and miles restored per minute. EV Stats aggregates manufacturer specifications and independent test results to help you compare charging curves, session times, and real-world range recovery across models. EV Stats can support that model-to-model review while you build a shortlist.