

An electric car can average 6.9 seconds from 0 to 100 km/h, while the quickest listed models reach the same speed in roughly 2.0 to 2.3 seconds. That spread, documented in a large cross-model database from EV Database's acceleration reference, tells us something important: electric car performance isn't one number. It ranges from calm, efficient family transport to acceleration that sits near supercar territory.
A useful definition includes more than launch speed. Performance also means how smoothly the car delivers power, how confidently it turns, how predictably it brakes, how far it travels in cold weather, and how quickly it can recover energy at a charger. A car that feels spectacular for one acceleration run may be less impressive on a winter highway or while towing.
The practical question is therefore not “How fast is this EV?” It's “How well does this EV perform in the conditions I face?” The answer depends on torque delivery, motor layout, battery weight, thermal management, range, charging behavior, temperature, load, and the testing method behind every quoted figure.
Table of Contents
- What Electric Car Performance Really Means
- Acceleration, Power, and Torque Explained
- How Motor Layouts Shape Real-World Driving
- Handling, Braking, and the Weight Factor
- Cold Weather and Why Your Range Drops
- Towing, Load, and the Hidden Range Tax
- How EV Performance Is Tested
- Putting It Together for Your Next EV
What Electric Car Performance Really Means
Performance breaks down into six measurable dimensions. Acceleration is the most obvious because you feel it immediately, but it describes only one part of an electric car's ability. The average 0–100 km/h time of 6.9 seconds spans relaxed everyday models and cars reaching 100 km/h in approximately 2.0 to 2.3 seconds, as shown earlier in the EV Database's model comparison.
The useful question is how consistently an EV performs in the conditions you face. A commuter may prefer predictable charging to a dramatic launch, while a performance-focused driver may prioritize immediate response. Usable performance is scenario-dependent, and range, charging time, temperature, and payload belong in that assessment.
The full performance package
- How quickly does it accelerate? Consider standing starts as well as rolling acceleration, such as joining traffic or passing on a highway.
- How consistently does it deliver power? Strong output with a warm, nearly full battery does not guarantee the same response when the battery is cold or its charge is low.
- How does it handle? Battery placement, suspension tuning, tire choice, and weight distribution shape cornering confidence.
- How does it stop? Regenerative braking and friction brakes must work together, with a predictable pedal transition.
- How far does it travel? Range changes with speed, temperature, cabin heating, and load, so it is part of performance rather than a separate ownership concern.
- How rapidly can it recharge? On a long trip, performance includes how much usable energy returns during each charging stop, not merely the battery's size.
A peer-reviewed 2018 analysis of battery-electric vehicles examined variables including 0–60 mph time, peak battery power, battery size, and driving range. For long-range models above 150 miles, the relationship between battery size and range had a slope of 6074 miles per kWh/kg, compared with 5002 miles per kWh/kg for models below 150 miles. The result points toward improving energy density and system optimization, rather than relying only on a larger battery.
Practical rule: Treat each performance number as one coordinate on a larger map. Choose the EV that remains capable across your routine, climate, roads, passenger load, and charging access.
Acceleration, Power, and Torque Explained
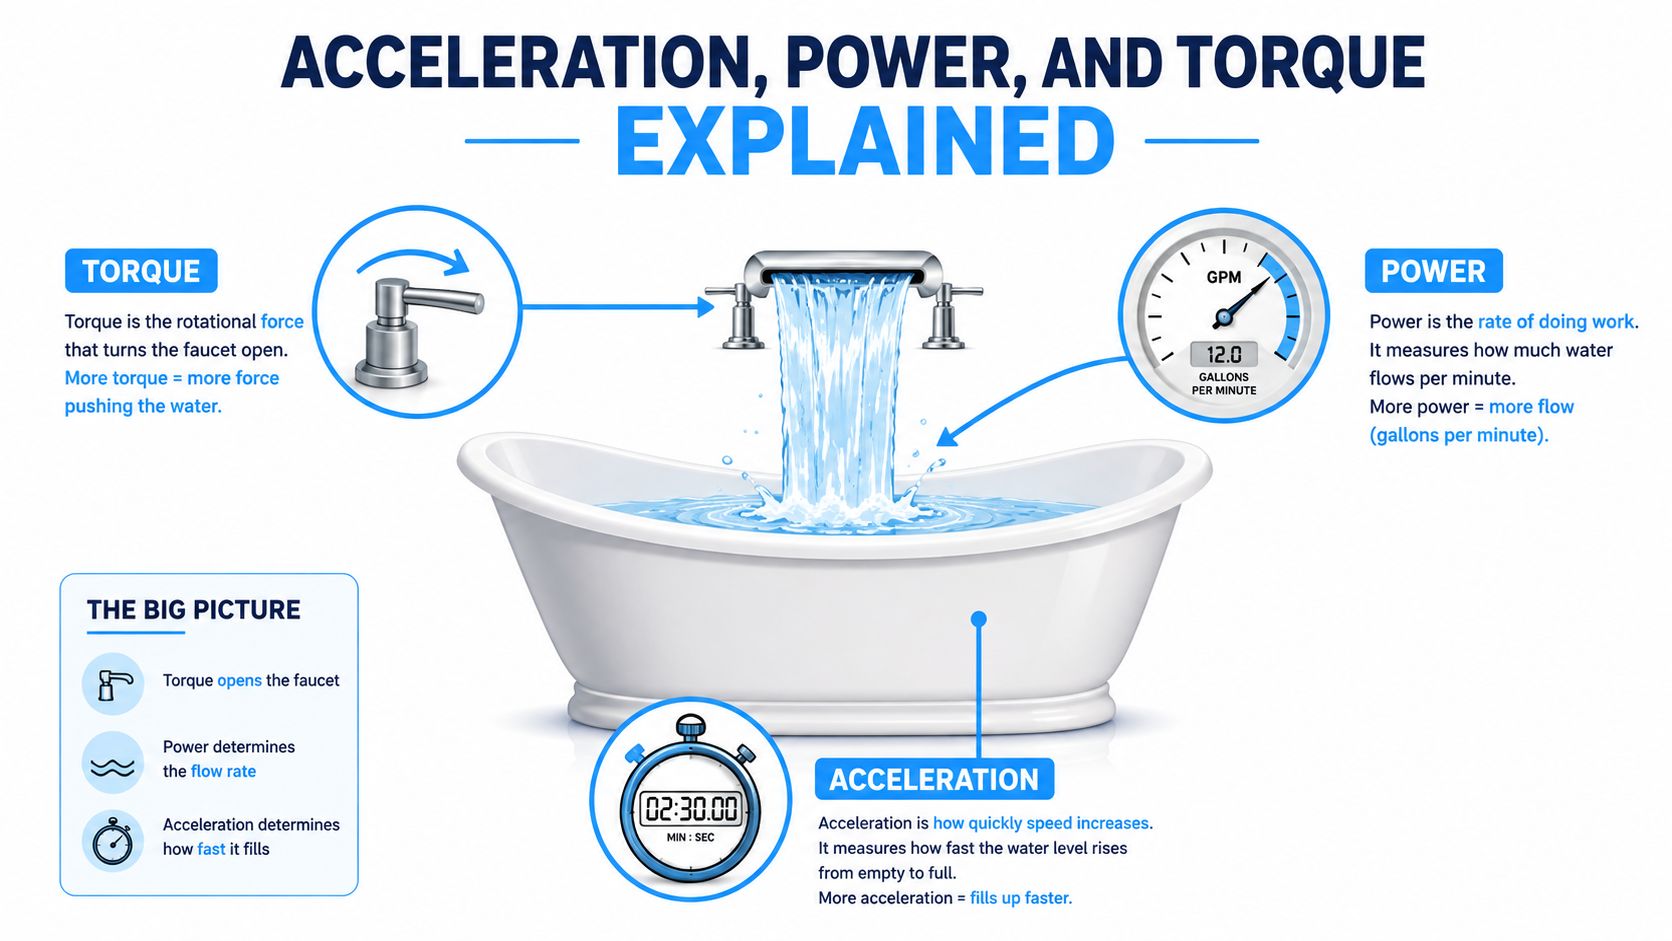
The simplest way to separate torque, power, and acceleration is to think about filling a bathtub.
Torque is the forceful flow from the faucet. It describes the twisting force available at the motor shaft. Power is the rate at which the tub fills, combining force with how quickly the motor can keep applying that force. Acceleration is the rising water level, or how quickly the vehicle's speed increases.
An electric motor can produce strong torque from very low rotational speed. A petrol engine usually needs to build revs before it reaches its strongest output, while an EV can respond as soon as the driver presses the accelerator. That's why a modest electric car can feel more immediate than a petrol car with a similar or even higher peak power rating during ordinary traffic launches.
Kilowatts, horsepower, and usable thrust
Kilowatts measure power. Horsepower expresses the same broad idea in a different unit. Neither figure alone tells you exactly how fast a car will feel because acceleration also depends on vehicle mass, gearing, traction, software limits, battery state of charge, tire grip, and aerodynamic resistance.
For example, a compact EV with a 150 kW motor may feel exceptionally responsive in urban driving, even when compared with a petrol vehicle rated at 200 hp, because the EV delivers torque immediately and avoids gearshift interruptions. That example illustrates the principle rather than guaranteeing a particular result. Two cars with those ratings can behave differently.
Top speed usually matters less in daily driving than mid-range response. A car that can smoothly accelerate from a lower cruising speed to a highway passing speed may feel faster and safer than one with a high top-speed limit but weaker sustained output. Battery temperature and charge level also matter, since the control system may reduce power when the pack is too cold, too hot, or nearly depleted.
The quoted 0–100 km/h range shows why buyers should separate instantaneous acceleration from repeatable performance. The fastest EVs demonstrate what electric drivetrains can do, but a balanced family car may provide all the response most drivers can use while consuming less energy and placing fewer demands on tires and thermal systems.
How Motor Layouts Shape Real-World Driving
Motor count changes how an EV manages traction, energy use, and repeatable performance. A single-motor car often favors efficiency and range because it carries fewer drive components. A dual-motor model can control the front and rear axles separately, while designs with three or four motors add finer control and greater acceleration potential.
That choice connects specification-sheet figures to daily conditions. More motors may improve launch traction, yet they also add hardware, mass, cooling demand, and electrical losses. The result can be quicker acceleration but shorter range, particularly during repeated high-power driving or on steep roads.
Comparing the main layouts
| Layout | Typical 0–100 km/h | Efficiency impact | Best use case |
|---|---|---|---|
| Single motor | Varies widely by vehicle tuning | Usually the lowest consumption of the three | Efficient commuting and long range |
| Dual motor | Varies widely, often quicker and more traction-limited | Adds motor, inverter, and hardware losses | All-weather driving and balanced performance |
| Tri-motor | Can support extreme acceleration | Higher mass and power demand can reduce efficiency | High-performance road use |
| Quad motor | Depends heavily on software and vehicle design | Adds considerable system complexity and energy demand | Specialized performance, off-road, or heavy-duty applications |
A dual-motor system can send more drive force to the axle with grip, reducing wheel slip before the driver notices it. With advanced control, separate motors can also vary torque from side to side. This arrangement, commonly called torque vectoring, can help the car rotate into a corner or remain stable during a direction change.
The trade-off is physical. Extra motors, inverters, cooling circuits, wiring, and structural components add mass and consume energy. Tri-motor and quad-motor systems can deliver very fast launches, but daily driving may benefit more from dependable traction, quiet response, and efficient cruising than maximum output.
Motor layout also affects what happens after the first acceleration run. Repeated hard launches heat the battery, motors, and inverters, and the control system may reduce output to protect them. Liquid cooling, software controls, and tighter integration manage that heat more effectively in modern EVs, although they cannot remove the underlying energy demand.
Thermal consistency remains part of performance for drivers who accelerate repeatedly, tow, climb steep grades, or drive quickly in hot weather. Cold conditions can also limit available power and reduce range, so the most useful layout is the one that delivers predictable response across the journeys you make, not just the highest peak output.
Handling, Braking, and the Weight Factor
An EV's battery usually sits low in the floor between the axles. That arrangement lowers the center of gravity and can reduce body roll compared with a similarly tall combustion vehicle. It also gives engineers a stable platform for suspension tuning.
Low mounting doesn't erase mass. A large battery can make an EV heavier than a comparable petrol car, increasing inertia during braking and direction changes. The vehicle may feel planted in a fast bend yet less eager when transitioning from one corner to the next. Tires, dampers, springs, suspension bushings, and brake components must all manage that extra load.
What to inspect beyond acceleration
Handling quality comes from the interaction of several parts:
- Battery position: A low, centrally located pack supports stability, but its total mass still affects agility.
- Motor placement: Rear, front, or all-wheel drive changes how the car responds under acceleration and cornering.
- Suspension calibration: Spring and damper tuning determine whether the vehicle feels controlled or heavy.
- Tire specification: Grip, sidewall stiffness, rolling resistance, and temperature behavior can change the character of the same model.
- Steering response: Software assistance and front-axle loading influence precision and confidence.
- Brake blending: The transition between regenerative and friction braking determines pedal consistency.
Regenerative braking can slow the car while returning some kinetic energy to the battery. At high state of charge, low battery temperature, or a battery that can't accept much current, the system may reduce regeneration. Friction brakes then need to provide more stopping force, so a good evaluation should include repeated stops and varied battery conditions rather than a single headline distance.
| Vehicle category | Typical battery placement | Mass effect | Braking consideration |
|---|---|---|---|
| Compact hatchback | Low floor, between the axles | Lower mass can support agility | Regeneration may do much of the routine slowing |
| Large sedan | Low central pack | Stable platform, but greater inertia | Brake cooling and pedal blending deserve attention |
| Electric SUV | Low floor with tall body structure | Low center of gravity helps control body movement | Tire load and repeated-stop consistency matter |
| Electric pickup | Low frame-mounted pack | High mass becomes more noticeable under load | Towing and payload can increase brake demand |
Buyers comparing suspension equipment should also consider how features such as rear air suspension affect ride height, load control, and comfort. The right specification depends on use, not only on the presence of an advanced component.
Cold Weather and Why Your Range Drops
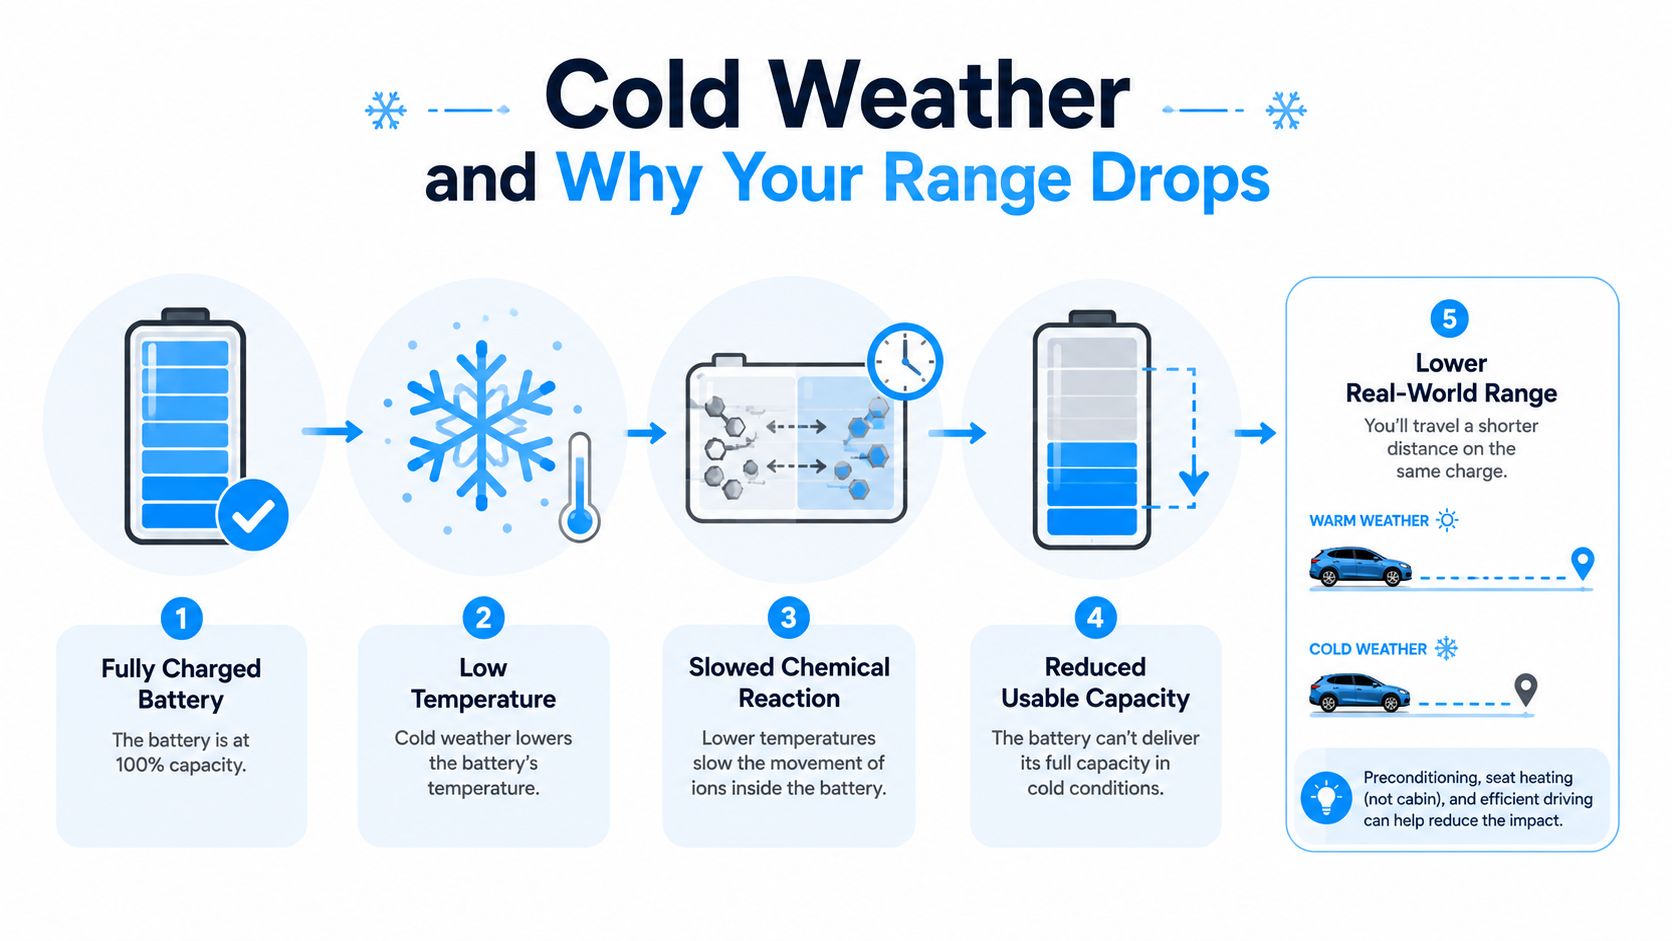
A fully charged battery doesn't guarantee its warm-weather distance in winter. In Fairbanks, Alaska, EVs continued operating reliably down to −40°C, but testing still found a significant efficiency penalty, while an NREL case study and related winter analysis reported that below 10°C, electricity consumption increased by about 2.4 kWh/100 km for every 5°C decrease in ambient temperature.
Cold affects more than stored energy. Battery chemistry works more slowly, the cabin heater draws power, the pack may need heating, tire rolling resistance rises, and cold air increases aerodynamic drag. A cold-soaked battery also accepts charging current less freely, so the same weather that shortens driving range can extend a charging stop.
Why preconditioning changes the result
A review of low-temperature EV behavior found an average summer-to-winter charging-power difference of 6.63 kW, because fast-charging current is limited by battery temperature, as documented in this IEEE Access review of EVs under low temperatures. FIA winter testing at −32°C found that 24 EVs averaged a 38% range reduction versus WLTP, yet most came close to their stated 10% to 80% charging times when drivers used battery preconditioning.
Preconditioning warms the battery and cabin while the vehicle is connected to a charger. That can improve early-trip efficiency, make acceleration more consistent, and prepare the pack to accept power sooner at a fast charger. It doesn't remove every winter penalty, but it prevents the first part of the journey from being spent heating a very cold system.
Use conservative planning in cold climates. Recent winter testing reported losses of roughly 20% to 40% of rated range in freezing conditions, with extreme-cold results averaging around 38% to 41% below WLTP and individual models ranging from about 14% to 46% lower than official figures, according to recent ADAC winter-test coverage.
For practical guidance on estimating usable distance, see EV range in cold weather. Keep a buffer before charging stops, use seat and steering-wheel heaters where practical, reduce speed, and don't treat the dashboard estimate as a promise.
Towing, Load, and the Hidden Range Tax
Towing reveals a weakness in many simple EV comparisons. A vehicle may have impressive acceleration and long official range, yet lose a large portion of its usable distance when it pulls a trailer at highway speed.
Recent independent coverage indicates that towing can reduce EV range by about 30% to 55%, with some tests and guides reporting losses of 35% to 60%, depending on trailer weight, speed, and vehicle type, as summarized by Black Series' EV towing range coverage. These figures aren't a universal prediction for every vehicle. They show how sharply conditions can change the energy requirement.
Why shape can matter more than weight
Extra mass increases the energy needed to accelerate and climb. It also increases rolling resistance. But at highway speeds, aerodynamic drag can dominate the result, especially when a caravan or broad trailer adds frontal area and disturbs airflow.
That means a light but tall trailer may hurt range more than a heavier, narrow load. A roof box, open trailer, or poorly shaped cargo can create a similar problem by increasing drag. The motor may have ample power, but the battery must supply energy continuously to overcome resistance.
| Condition | Typical range impact | Main cause | Practical mitigation |
|---|---|---|---|
| Unladen urban driving | Lower impact than loaded highway travel | Moderate speed and frequent regeneration | Use smooth acceleration and efficient climate settings |
| Heavy cargo | Range falls as vehicle mass rises | More work during acceleration and climbs | Distribute weight evenly and remove unnecessary items |
| Small enclosed trailer | Variable reduction | Added mass and aerodynamic drag | Keep speed moderate and maintain loaded tire pressure |
| Broad caravan | Often the most severe penalty | Large frontal area and turbulent airflow | Plan shorter legs and dependable fast-charging access |
| Cold towing | Penalties combine | Heating demand, cold battery, load, and drag | Precondition and calculate a larger energy reserve |
A towing-capacity figure tells you what the vehicle can pull safely. It doesn't tell you how efficiently it will travel while doing so. Before a trip, estimate a reduced range, account for charging time, set tires to the manufacturer's loaded pressure, and choose a route with reliable chargers. Effective energy use per kilometer under load is more useful than battery size alone.
How EV Performance Is Tested
A published test-cycle result is a controlled measurement, not a promise for every road. WLTP, EPA, and independent programs such as ADAC use different procedures, conditions, and reporting methods. Their figures are useful within their own systems, but direct comparisons can mislead.
WLTP and EPA answer different questions
WLTP is used widely in Europe and other markets. It measures consumption, emissions, and range during a standardized laboratory cycle. EPA testing in the United States follows its own procedures and adjustments, including different driving and climate assumptions. Its reported range may therefore feel more conservative to some drivers.
The fairest comparison is between vehicles tested under the same protocol. Even then, the result does not fully represent sustained high-speed travel, severe cold, strong cabin-heating demand, wind, wet roads, hills, or towing. These conditions increase energy use, so independent road tests often show a wider spread than a brochure table.
ADAC Ecotest provides another reference by assessing vehicles under road-oriented conditions rather than relying only on certification results. Its outcome still depends on the route, weather, tires, battery state, and charging setup. Those variables are part of performance because they affect both usable range and the time needed to recover it.
Read the metrics as a group
| Protocol | Cycle length | Average speed | Temperature range | Real-world gap |
|---|---|---|---|---|
| WLTP | Controlled laboratory cycle | Mixed urban and faster sections | Controlled laboratory conditions | Can be larger during winter, high-speed, or loaded driving |
| EPA | Controlled laboratory testing with adjustments | Different profile from WLTP | Includes different climate assumptions | Often closer for some drivers, but still not a personal guarantee |
| ADAC Ecotest | Independent test program | Road-oriented evaluation | Test-day conditions vary | Helps expose model-to-model differences outside certification |
A quoted 0–100 km/h time measures a launch. An 80–120 km/h result better represents passing response. Magazine results can differ from manufacturer figures because of tire specification, temperature, battery charge, road surface, launch strategy, and whether the battery starts warm.
Charging figures need the same reading. Peak DC power is not the same as average charging power. The car may briefly reach its maximum, then reduce output as the battery fills or its temperature changes. A vehicle with about 560 km of range, 350 kW DC charging, and an 80% session taking roughly 35 minutes shows why range and charging speed belong in one performance assessment, as documented in the EV Database performance and charging reference. For a road trip, the practical measure is how much driving distance returns during a normal stop, under conditions close to your own.
Putting It Together for Your Next EV
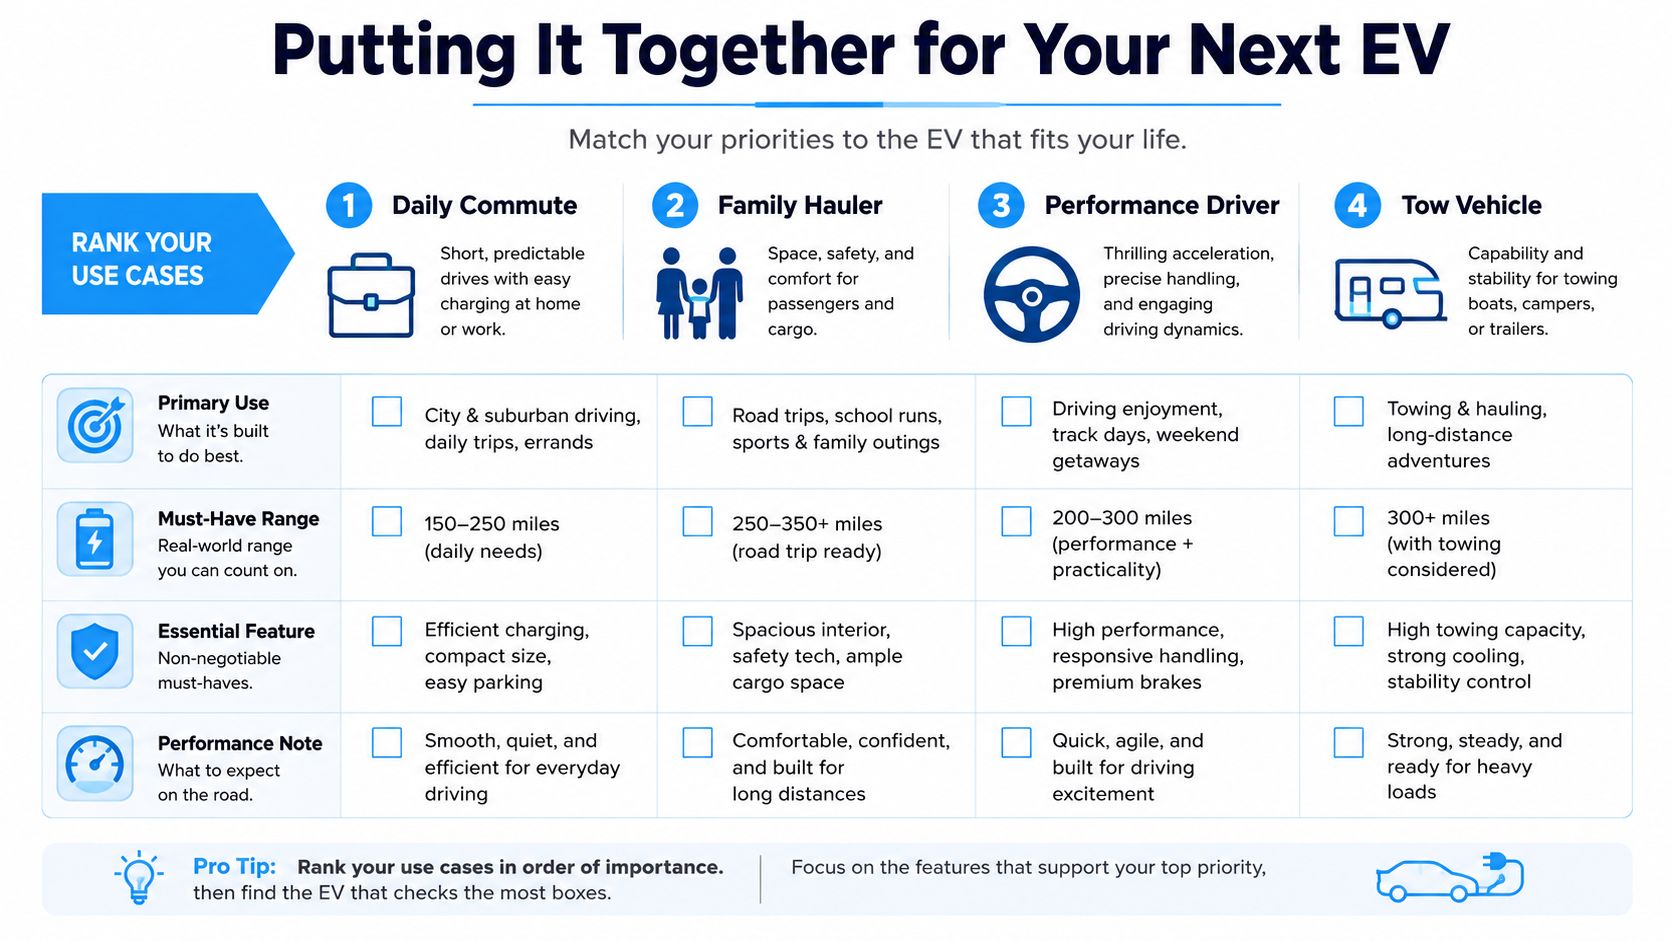
Choose the use case before choosing the specification. A daily commuter, family hauler, performance driver, and tow vehicle can all need different versions of “good performance.”
Start with this checklist:
- Daily commute: Prioritize efficiency, predictable winter range, and convenient overnight charging. Strong launch performance is welcome, but low energy use usually matters more.
- Family hauler: Look for stable handling, comfortable suspension, usable rear space, and charging that remains practical during loaded trips.
- Performance driver: Compare 0–100 km/h with rolling acceleration, repeated-run consistency, tire specification, and brake behavior.
- Tow vehicle: Treat towing range, payload, thermal control, and charger spacing as core performance data, not optional footnotes.
A car averaging 6.9 seconds from 0 to 100 km/h is already quick enough for most normal driving, based on EV Database's cross-model reference. For many buyers, highway efficiency and charging recovery will affect daily convenience more than another step in acceleration. A lower consumption figure can reduce charging frequency even when a different vehicle advertises a larger headline range.
Build a real-world comparison
Use a consistent process:
- Match the test condition to your life. Compare highway performance if you regularly drive long motorway routes.
- Check charging behavior, not only peak power. Look for the charging curve, the useful 10% to 80% window, and the distance recovered per stop.
- Apply a climate adjustment. Winter users should compare independent cold-weather results and plan a reserve.
- Add the load. If you tow or carry bulky equipment, judge aerodynamic impact as carefully as rated capacity.
- Separate desire from need. Extreme acceleration can be rewarding, but it brings compromises in efficiency, tire wear, hardware, and purchase cost.
Use a structured electric car specifications comparison to place range, battery capacity, efficiency, powertrain, charging, and acceleration beside one another. Then test the shortlist against your actual route and temperature rather than accepting a single official figure.
A vehicle that travels 400 km in mild conditions may deliver only 280 km in January if winter reduces usable range by the relevant amount. That relationship is an example of why climate belongs inside the performance calculation, not in a separate ownership footnote. The most convincing EV on paper may be less suitable than a slower model that charges efficiently, handles your load, and retains more practical range in your region.
EV Stats brings manufacturer specifications and independent test results into comparable EV profiles, including range, efficiency, powertrain, charging, and acceleration data. Visit EV Stats to compare models side by side and use charging and ownership tools to test which vehicle fits your routes, climate, and real-world performance needs.