

The highest advertised charging figure doesn't automatically identify the best road-trip EV. Peak kilowatts describe a ceiling, not the speed you'll experience across a useful stop. A car that briefly reaches a high peak and then tapers sharply can add less usable trip energy than one that sustains a lower average power.
A meaningful comparison of DC fast charging cars should examine peak kW, average power across a practical state-of-charge window, 10–80% behavior where available, battery chemistry, thermal preparation, charge-curve shape, and the range added during a realistic stop. Manufacturer specifications and independent tests may reflect different temperatures, starting charge levels, chargers, and test methods, so a single headline figure can mislead.
This guide ranks seven research and comparison tools that help expose those differences. EV Stats is the central companion, with normalized specifications, fastest-charging leaderboards, side-by-side comparisons, a long-distance rating, and a Charging Simulator. The list moves through route planning, charge-curve databases, operator data, benchmark testing, and consumer-focused charging results before ending with a practical buying workflow.
Table of Contents
- 1. EV Stats
- 2. A Better Routeplanner
- 3. EVKX.net
- 4. Fastned Brands Overview
- 5. P3 Charging Index
- 6. Edmunds EV Charging Test
- 7. EV Database
- 7-Source Comparison: DC Fast-Charging
- Choose the Charging Curve, Not the Headline
1. EV Stats
A high peak kW figure is a poor standalone ranking for road-trip speed. EV Stats offers a better starting point by comparing charging capability through standardized specifications and independent test results. Its database covers 1,374 models across 75 brands, with normalized units and pricing references in EUR, USD, and GBP.
The useful question is how much energy a car can recover during a realistic stop. That requires looking beyond peak power at average power, the usable high-power window, charge-curve behavior, battery information, efficiency, range, and performance. EV Stats places these fields in one comparison environment, making it easier to separate a brief maximum from sustained charging that supports a journey.
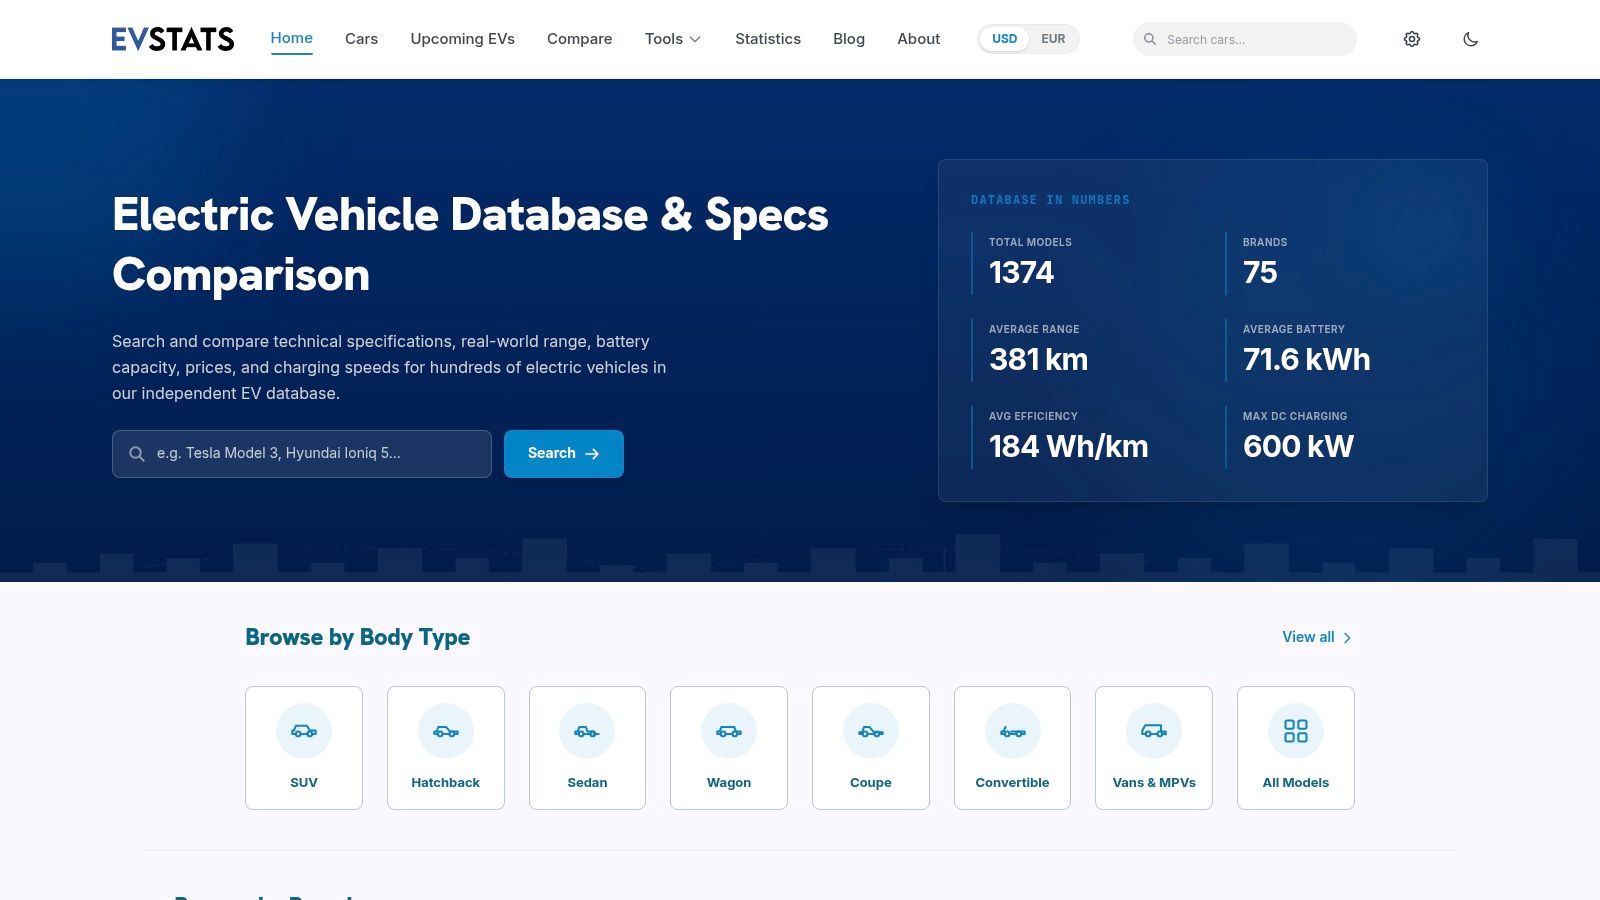
Why EV Stats stands out
The platform's side-by-side comparison tool supports up to four models. That allows a short list, such as the Lucid Air Grand Touring, Tesla Model 3, and other long-distance EVs, to be assessed using the same fields rather than disconnected manufacturer pages. Its leaderboards organize vehicles by range and charging speed, while the long-distance rating combines range and charging speed to reflect highway use more closely.
This combined view changes the ranking. A large battery may reduce stop frequency, while efficient energy use and a stable charge curve can help a vehicle recover more usable trip energy at each stop. EV Stats also shows value measures such as price per range unit, but its prices are indicative public-data references, not guaranteed dealer quotes or live inventory.
Practical rule: Use peak charging power to create a shortlist. Use average power, the sustained high-power window, charge-curve behavior, thermal performance where available, and simulated stop duration to choose among candidates.
The Charging Simulator converts specifications into a route-planning exercise. It models charging power, session duration, and trip top-ups, helping you test different starting charge levels and stop patterns instead of assuming every session follows the same curve. The platform also provides an interactive TCO calculator, regularly updated articles, a weekly newsletter, and API access for teams integrating EV data.
For readers still separating charging standards, the guide to EV charging levels explains the difference between AC and DC systems. The comparison and simulation tools then support a more realistic test: estimate how quickly each candidate adds usable trip energy, rather than selecting the vehicle with the largest peak number.
Pros
- Broad standardized coverage: Compare models across a large catalog with normalized units, charging fields, and multi-currency references.
- Journey-focused analysis: Combine the long-distance rating with the Charging Simulator to connect charging behavior with travel decisions.
- Independent presentation: EV Stats states that it has no sponsored bias or paid placements and identifies public manufacturer and independent-test sources.
- Useful for different audiences: Individual buyers, fleets, journalists, analysts, and developer teams can work from the same structured data.
Cons
- Indicative pricing: Public prices can differ by country, dealer, incentives, trim, and timing.
- Not a marketplace: The platform supports research and planning, but it does not sell vehicles or guarantee real-time availability.
2. A Better Routeplanner
A Better Routeplanner answers the question that specification sheets often avoid: how long will this particular stop take on this particular journey? Its route planning is built around per-model vehicle parameters and charging curves, so the result can reflect the way a car's power changes as its battery fills.
That makes ABRP especially useful after you've narrowed your shortlist. Instead of comparing a theoretical maximum with another theoretical maximum, you can model route stops and see how charging behavior affects the journey. The tool is designed around practical routing, including predicted stop lengths and vehicle-specific charging behavior.
A planning tool for charge-curve reality
ABRP's vehicle database contains model-specific parameters used in routing and predictions. For some vehicles, live-data integration can record real charging sessions, which supports ongoing refinement of the vehicle model. That distinction matters because a new EV may have limited independent charging data, while an established model may have a better-developed curve based on observed sessions.
The platform is most valuable for drivers who care about the total route rather than a single charging session. A vehicle with a strong early peak may look impressive in a standalone chart, but route planning can reveal whether it needs more frequent stops, whether a larger battery offsets a slower average, or whether the chosen charging locations fit the vehicle's behavior.
A route planner should be judged by the stop it predicts, not only by the peak power displayed on a vehicle page.
ABRP also offers business and API access for organizations that want to integrate route logic into fleet or mobility workflows. The trade-off is that some advanced functions, including deeper live-data analysis, require a Premium subscription. New vehicles can also be harder to model accurately until enough real charging sessions are available.
Best use: Run the same journey with several candidate vehicles and compare total stop time, not just the first few minutes of charging.
3. EVKX.net
EVKX.net is suited to readers who want variant-level technical detail. Its independent EV encyclopedia separates model years and variants, then provides structured specifications and dedicated DC charging-curve pages. That granularity helps prevent a common research error, treating every version of a vehicle as if it had identical battery chemistry, usable capacity, or charging hardware.
The site's charging presentation focuses on metrics that matter during travel, including average DC power and 10–80% times where data is available. Those measures are more useful than a peak figure because they summarize performance across a meaningful portion of a session. A curve also shows whether power remains strong through the middle of the battery window or falls away early.
Granular data for careful comparisons
EVKX makes its data model and sources visible, and it provides an API for partners and integrations. It also includes rankings and calculators that use charging-related measures, allowing a technically minded buyer to move from raw vehicle pages toward comparative analysis.
The interface is data-dense, which is a benefit if you're checking a precise variant and a drawback if you want a quick, simplified shopping answer. Some entries may rely on manufacturer information or inferred curves when independent testing isn't available. Readers should therefore distinguish between observed performance and a modeled or published estimate.
A sensible workflow is to select the exact battery and drivetrain version first, then inspect the curve and the basis for the data. The difference between a large battery option and a smaller one can affect both trip range and charging time, while a regional specification may use different connectors or charging limits.
Pros
- Variant precision: Model-year and drivetrain distinctions reduce the risk of comparing unlike versions.
- Curve visibility: Dedicated pages expose how power changes across the session.
- Transparent structure: Sources, metadata, feedback, and issue tracking make the data easier to scrutinize.
- Integration potential: API access supports research systems and analytical workflows.
Cons
- Uneven evidence: New or lightly tested vehicles may have estimated rather than independently observed curves.
- Learning curve: The detailed interface can feel technical for casual shoppers.
EVKX is best used when a promising vehicle needs a closer engineering-level inspection before you treat its advertised charging performance as representative.
4. Fastned Brands Overview
Fastned's Brands Overview provides a valuable reality check because it publishes model-specific DC charging-curve graphics gathered from sessions on the operator's high-power network. These curves show the relationship between charging power and state of charge, helping readers see whether a vehicle sustains power or merely touches a high maximum.
The operator context is useful. Fastned also explains connector selection, compatibility, and why a car may not reach its advertised power. That guidance reinforces a point many buyers miss: the station's capability is only one part of the session. The vehicle's battery limits, temperature, starting state of charge, charger configuration, and charging conditions all affect the result.
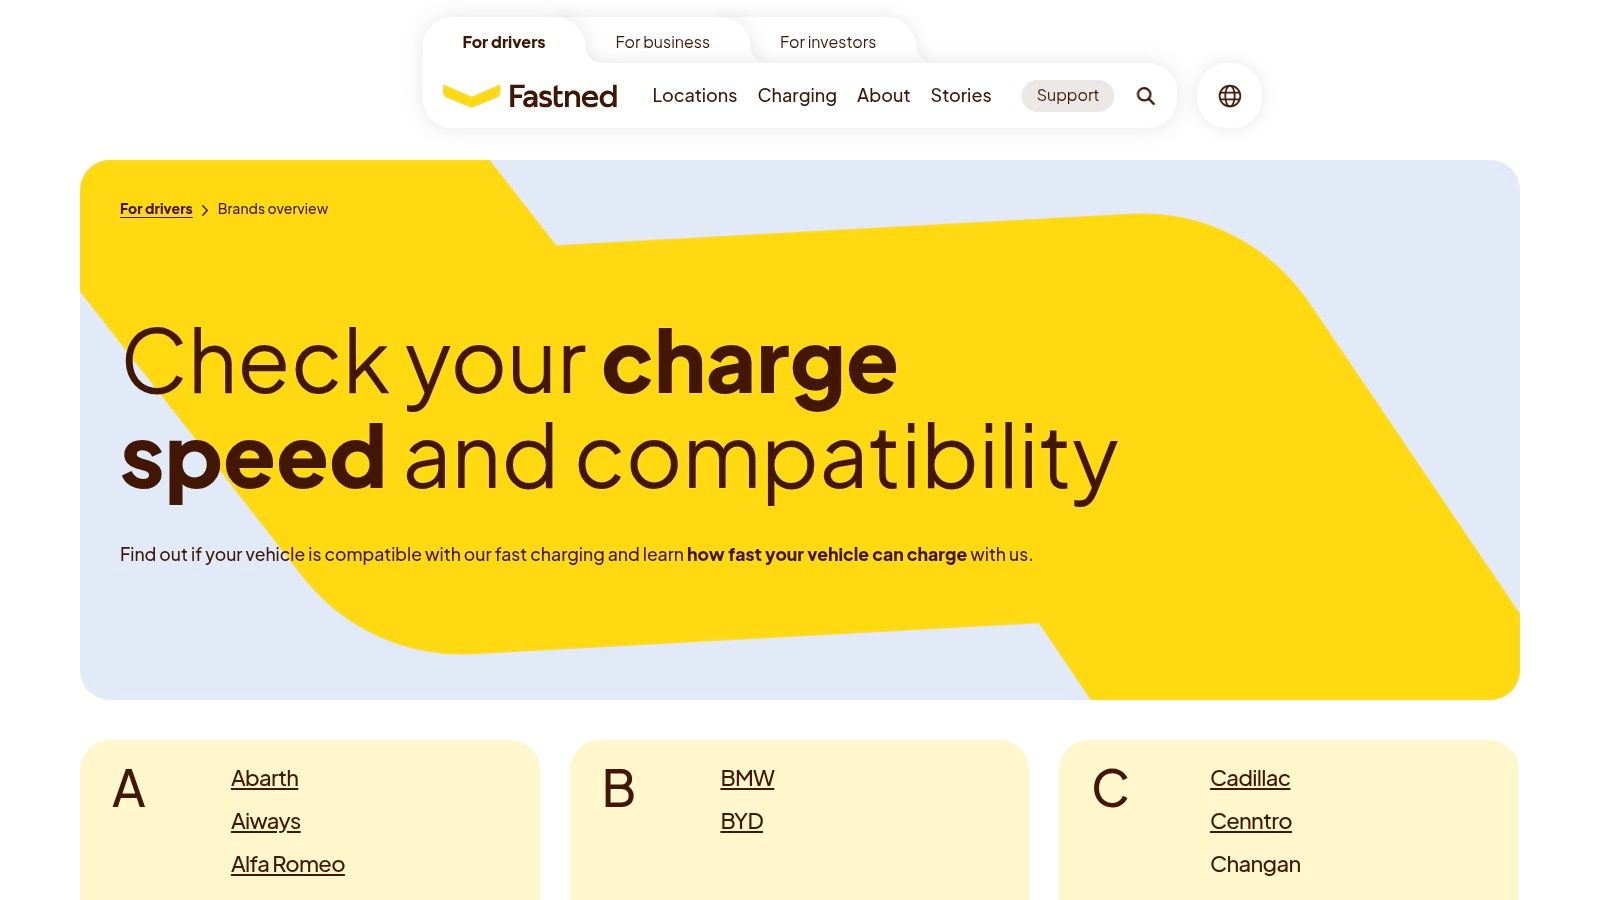
A visual sanity check
Fastned's graphics are particularly helpful when a vehicle's marketing page highlights peak power without showing the taper. A curve that holds a substantial level through the middle of a session can support quicker trip top-ups than a curve that drops soon after its maximum. The visual shape won't replace a controlled test, but it can expose unrealistic assumptions before a purchase.
The library's limitation is equally important. Coverage reflects vehicles common in Fastned's markets, and the published curves represent optimal conditions. A cold battery, a busy site, a different charger design, or a high starting state of charge can produce a slower session.
The useful question isn't “What's the peak?” It's “How much power does the car keep while I'm adding the energy I need?”
For a plain-language explanation of the underlying process, consult how EV charging works. Then compare the curve with an independent database or route simulation. Agreement across sources increases confidence, while a mismatch signals that you should investigate test conditions and vehicle variant before drawing a conclusion.
Best use: Check whether a claimed high-power vehicle maintains meaningful power across the state-of-charge range you will use on journeys.
5. P3 Charging Index
The P3 Charging Index takes a benchmark-oriented approach to long-distance EV performance. Rather than treating maximum DC input as the main result, its methodology emphasizes average charging power and 10–80% time when comparing travel suitability.
That framing aligns closely with how drivers use public fast chargers. Most road-trip stops are top-ups, not attempts to fill the battery completely. A repeatable window makes it easier to compare cars under a common framework, especially when manufacturers use different definitions for “fast charging” or quote best-case times from different starting conditions.
Why average power changes the ranking
Average power captures the whole tested window. It accounts for the strong opening portion, the middle of the curve, and the taper that appears as the battery approaches a higher state of charge. This can reorder a shortlist built from peak values alone.
The index also publishes its methodology and per-vehicle results in an accessible report. That transparency lets readers understand what the benchmark measures and where its conclusions apply. It's a useful complement to a vehicle database because it provides a repeatable test framework rather than only a specification record.
Pros
- Travel-focused metrics: Average power and 10–80% time connect directly to charging-stop efficiency.
- Repeatable comparisons: A common framework makes cross-model results easier to interpret.
- Published methodology: Readers can examine the basis for the rankings and per-vehicle results.
- Useful shortlist filter: The results help identify vehicles worth deeper route simulation.
Cons
- Edition coverage: The report covers the models and regions included in that edition.
- Update timing: A recurring report can trail a newly launched vehicle or later software changes.
Use the P3 results as a benchmark, not as a universal promise. A car's performance can change with battery temperature, charger conditions, software revisions, and the exact variant tested.
6. Edmunds EV Charging Test
Peak kW is an incomplete measure of charging speed. The Edmunds EV Charging Test evaluates DC fast charging for US-market shoppers through charging times, observed power, peak-power behavior, and miles added per hour. Together, these measures show how a vehicle performs across a session, not just its best moment.
Miles added per hour connects charging performance with trip utility. Battery capacity alone cannot predict road-trip progress. Two cars may accept similar power yet restore different driving distances because efficiency differs. An efficient vehicle with a smaller battery can therefore add more usable route energy during a stop than a less efficient vehicle with a larger pack.
Consumer testing with engineering context
Edmunds' consistent 10–80% window supports direct comparison across tested models. Observed power reveals what the car drew during testing, while the charge time reflects the entire window and exposes tapering that a peak rating hides. For the full test details, see the fastest EV charge guide.
The US focus helps American buyers interpret results, but it also limits transferability. Regional trims, battery suppliers, connector systems, and software settings may differ elsewhere. Coverage varies by model and model year, so one tested version should not represent every vehicle with the same name.
Compare the energy added, not only the minutes spent plugged in. A short session matters when it restores the range your route requires.
Use Edmunds as a practical baseline, then confirm the tested trim and compare its curve behavior with EV Stats comparison and simulation tools. That check can reveal whether a strong average power result remains useful for your route, temperature, and charging window. It is more informative than relying on a manufacturer's peak figure or a charger rating alone.
Best use: Compare popular US-market EVs through a consistent 10–80% window, observed power, and a range-per-time measure that ordinary drivers can understand.
7. EV Database
EV Database is a quick, accessible reference for checking the DC fast-charging basics of a model. Its per-model Fast Charging sections present 10–80% estimates, average power, and charge-curve visuals for many vehicles. The standardized layout makes it easy to scan several candidates without first learning a complex data model.
That simplicity makes EV Database a useful first pass. You can identify whether a vehicle has a substantial charging capability, whether its average power appears competitive, and whether a curve is available for closer review. The site also covers current and upcoming models, with frequent updates as information changes.
The database is most useful when you treat it as a starting point rather than the final authority. Some model pages rely on manufacturer data when independent testing isn't available, and not every vehicle has a published curve graphic. A quoted 10–80% time can therefore represent a specification or estimate rather than a controlled third-party result.
How to use the pages responsibly
Start with the exact model and variant. Then compare the listed average power with the 10–80% estimate, and inspect the curve if one is available. If the figures look unusually strong, cross-check them against an independent test, an operator curve, or a route simulation before using them to plan a demanding journey.
Pros
- Easy comparison: The consistent page format is quick to scan.
- Useful first reference: Charging tables establish the basic DC fast-charging profile.
- Broad coverage: Many current and forthcoming vehicles appear in the catalog.
- Visual support: Curve graphics can reveal taper behavior where data exists.
Cons
- Mixed evidence levels: Some pages depend on manufacturer figures.
- Incomplete curves: A visual charging profile isn't available for every model.
EV Database is therefore a practical entry point, while EV Stats, ABRP, EVKX, Fastned, P3, and Edmunds can provide the additional context needed for a high-confidence purchase decision.
7-Source Comparison: DC Fast-Charging
| Tool | 🔄 Implementation complexity | ⚡ Resource requirements | ⭐📊 Expected outcomes | 💡 Ideal use cases | Key advantages |
|---|---|---|---|---|---|
| EV Stats | Medium, data ingestion, UI and API | High, normalized dataset, active updates, engineering | High, standardized specs, TCO & charging simulations | Buyers, fleet/procurement, analysts, dev teams | Comprehensive coverage, independent data, API & planning tools |
| A Better Routeplanner (ABRP) | High, routing core + per-model charge curves | Medium–High, live-data integrations, tuned models, premium services | High, accurate stop-length and routing estimates | Trip planning, estimating stop durations, route simulation | Practical per-model curves, live-data, strong routing focus |
| EVKX.net | Medium, variant-level data model and metadata pages | Medium, variant maintenance, API & feedback loop | High, granular charging-curve metadata and per-variant accuracy | Developers, researchers, data integrations needing granularity | Transparent sources, deep variant granularity, public API |
| Fastned, Brands Overview | Low–Medium, curve collection from operator sessions | Medium, consistent high-power network data capture | Medium, operator-centric, optimal-condition charge curves | Network operators, sanity checks, connector compatibility | Real-session curves on consistent network, clear visuals |
| P3 Charging Index | Medium, standardized benchmarking methodology | High, controlled tests, repeatable measurement program | High, ranked long-distance suitability and travel-time metrics | Benchmarking, fleet selection, comparative research | Repeatable framework, published methodology and results |
| Edmunds, EV Charging Test | Low–Medium, instrumented consumer tests | Medium, test vehicles & equipment, US-market focus | Medium, consumer-friendly 10–80% times and miles/hr | US shoppers comparing practical charging performance | Independent, easy-to-compare consumer metrics |
| EV Database | Medium, data aggregation and charge-curve visuals | Medium, frequent updates, broad model coverage | High, quick cross-model comparisons and sanity checks | Initial research, quick model comparisons, general reference | Broad coverage, standardized presentation, frequent updates |
Choose the Charging Curve, Not the Headline
A reliable buying workflow begins with the exact model year, battery, drivetrain, and regional variant. Charging hardware and software can differ between versions carrying the same model name, so confirm that the data you're reading applies to the vehicle you can buy.
Next, compare peak and average DC power. Peak kW tells you what the car may achieve under favorable conditions. Average power across a useful window tells you more about the energy recovered during a real stop. Then inspect the charge curve, focusing on the usable high-power window and the point where the vehicle begins to taper.
The 10–80% window is a helpful common reference, but it isn't the whole trip. A driver may arrive at a charger with a different starting state of charge, leave before 80%, or stay longer when the next station is far away. Battery temperature and preconditioning can also change the result, so treat every published figure as conditional rather than guaranteed.
Use EV Stats to filter charging leaders, compare up to four candidates, review the long-distance rating, and test trip assumptions in the Charging Simulator. Cross-check promising results with a route planner or an independent charge-curve source. That process exposes whether a vehicle's apparent advantage comes from sustained performance, efficiency, usable battery energy, or only a short-lived peak.
For frequent highway travel, a strong choice usually has:
- Sustained average power: It keeps charging quickly across the part of the battery window you'll use.
- A broad high-power window: The curve doesn't collapse immediately after the headline peak.
- Predictable top-up behavior: Independent tests and simulations produce comparable stop expectations.
- Efficient usable energy: The car adds meaningful trip range during each session.
- Thermal readiness: Battery preparation and temperature management support repeatable charging.
A model that merely advertises a high peak figure may still work well, but it needs evidence behind the number. Confirm regional specifications, indicative pricing, exact trim details, and current independent-test coverage before committing. The best DC fast charging cars aren't necessarily those with the largest number in a brochure. They're the ones that deliver the energy your route needs, in the time your stops allow.
EV Stats brings standardized specifications, charging-speed rankings, side-by-side comparisons, a long-distance rating, and a Charging Simulator together for researching DC fast charging cars. Visit EV Stats to compare your shortlist, test realistic charging stops, and choose a vehicle based on trip performance rather than peak kW alone.