

Global electric car sales exceeded 20 million in 2025, equal to 25% of all new cars sold worldwide. That scale means EV specifications are no longer a short list of brochure claims. They're a structured dataset in which range, charging power, efficiency, battery capacity, and test-cycle context must stay attached to every value. Power is kW; energy is kWh — see kW vs kWh in electric cars. The DC inlet is a separate field: NACS vs CCS. Towing is a kilogram cell: EV towing capacity.
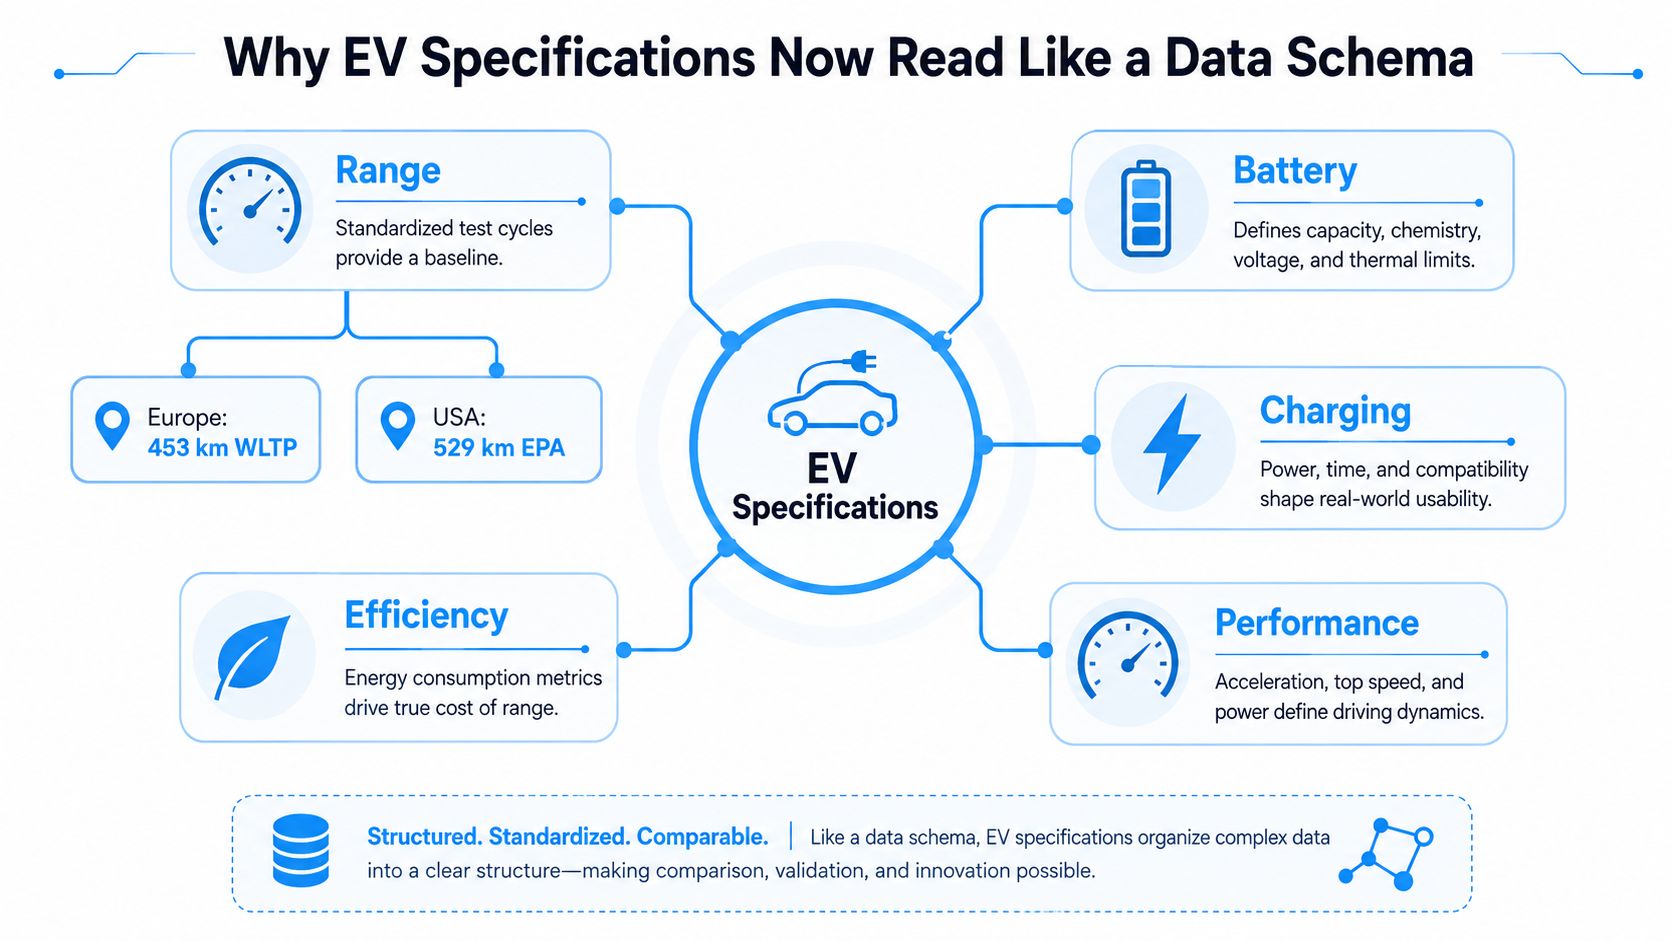
A modern EV specification has shifted from a handful of marketing figures into a standardized record measured under explicit systems such as WLTP and EPA. In 2025, average driving range reached 453 km in Europe and 529 km in the United States, according to the ICCT global EV market monitor. Those figures aren't directly interchangeable, and that distinction is exactly why data structure matters.
Table of Contents
- Why EV Specifications Now Read Like a Data Schema
- Core Powertrain and Battery Fields
- Range, Test Cycles, and How to Compare Them
- Energy Efficiency and Consumption Units
- AC and DC Charging Specifications
- Performance Metrics and Acceleration Data
- Dimensions, Weight, and Practical Vehicle Data
- Real-World Adjustments Beyond the Brochure
- A Developer-Friendly Example Specification Record
- Charging Experience Is a System, Not a Number
Why EV Specifications Now Read Like a Data Schema
The useful unit in an EV database isn't a number alone. It's a number with a unit, test standard, source, version, and interpretation rule.
A range value of 500 tells a developer almost nothing without knowing whether it means kilometres or miles, WLTP or EPA, gross or usable battery context, and a manufacturer claim or an independent measurement. A charging value of 200 is equally incomplete without voltage class, connector standard, state-of-charge window, and test conditions.
The market now demands this precision. Global EV sales exceeded 20 million in 2025, grew 20% year over year, and represented 25% of worldwide new-car sales, as reported in the IEA market milestone coverage. Europe reached 28% of total vehicle sales with EV sales growth of more than 30%, while Chinese automakers supplied about 60% of EVs sold globally. These regional differences create a data integration problem, not just a consumer comparison problem.
Build every field with four attributes
A normalized record should attach four things to each metric:
- Value and unit: Store range in kilometres, energy in kWh, power in kW, torque in Nm, and dimensions in millimetres unless a regional presentation layer requires conversion.
- Test standard: Keep WLTP, EPA, CLTC, or an independent highway test as a separate field rather than embedding it in descriptive text.
- Source type: Distinguish manufacturer specifications, homologation records, regulator labels, and measured tests.
- Adjustment rule: Record whether the value is certified, estimated, or adjusted for conditions such as temperature, speed, or payload.
This approach lets analysts join OEM records with regulatory data and telematics without treating unlike values as equivalent. It also makes comparisons reproducible. A fleet dashboard can filter for EPA range, a buyer tool can display WLTP, and a trip planner can use a measured highway estimate without overwriting the official figure.
Practical rule: Never store “range” as a standalone text string. Store the value, unit, cycle, source, and condition as separate fields.
The largest errors usually come from normalization. Converting miles to kilometres is easy. Preserving the difference between usable and nominal battery capacity, certified and measured range, or peak and sustained charging power requires a schema designed for those distinctions.
Core Powertrain and Battery Fields
Battery data forms the foundation of most EV specifications, but OEM terminology isn't consistent enough for direct copying. A clean record needs canonical fields and explicit sourcing rules.
Battery capacity and chemistry
Battery capacity belongs in kilowatt-hours. Store both gross or nominal capacity and usable or net capacity when the source provides both. Gross capacity describes the full pack, while usable capacity represents the energy available to the driver after the vehicle reserves a buffer.
Use usable capacity for range and efficiency calculations. If an OEM publishes only one capacity figure, preserve the original label and mark the interpretation as reported rather than assuming it means net energy. Battery energy density adds useful context when comparing pack size and vehicle mass, as discussed in this EV battery energy density reference.
Chemistry should be a categorical field, such as LFP, NMC, or NCA. Don't infer chemistry from range, price, or brand. Record the chemistry only when an OEM, homologation document, or credible technical source identifies it, because chemistry affects how analysts interpret charging, cold-weather behaviour, and durability without being visible in a headline range figure.
Voltage and motor configuration
Pack voltage class is separate from capacity. Store a nominal architecture label such as 400 V or 800 V, plus the voltage value when documented. Voltage class helps explain charging behaviour, but it doesn't tell you how much energy the pack stores.
Motor configuration should identify single-, dual-, or tri-motor layouts. Add motor position where available, such as front, rear, or all-wheel drive, and keep peak motor power distinct from continuous power. If the source reports system power rather than motor power, label it as system power instead of summing motor figures yourself.
A practical normalized record might look like this:
| Field | Canonical unit or format | Normalization rule | Example |
|---|---|---|---|
| Gross battery capacity | kWh | Preserve nominal or gross label | 82 kWh |
| Usable battery capacity | kWh | Use for energy calculations | 77 kWh |
| Pack voltage class | V or category | Separate architecture from energy | 800 V |
| Chemistry | Controlled text | Copy only from an identified source | NMC |
| Motor count | Integer | Store drivetrain variant separately | 2 |
| Peak system power | kW | Don't mix with continuous power | 239 kW |
| Continuous power | kW | Preserve only when documented | Reported value |
The same rules apply to every variant. A dual-motor trim isn't just a different drivetrain description. It may have different power, mass, efficiency, charging behaviour, and certified range, so it deserves its own record rather than a shared model row.
Range, Test Cycles, and How to Compare Them
Range is a test-cycle output, not a universal distance promise. The U.S. EPA fully charges an EV, runs it on laboratory dynamometer cycles until depletion, and applies adjustment factors for conditions including air conditioning, cold temperatures, high speed, and aggressive driving. The EPA range-testing explanation notes that the most common adjustment approach uses a 0.7 factor applied to test parameters.
That methodology makes EPA and WLTP useful, but not interchangeable. A database should store range_km and range_cycle as separate fields. It should also preserve the test-cycle version where available, because a revised procedure can change comparability across model years.
Keep cycle identity beside the result
| Test cycle | Region | Cycle characteristics | Typical vs WLTP |
|---|---|---|---|
| WLTP | Europe and many other markets | Laboratory procedure designed to represent varied driving phases | Baseline for the comparison |
| EPA | United States | Laboratory cycles with adjustment for real-world influences | Often lower than WLTP on the same vehicle |
| CLTC | China | Regional laboratory procedure with a different speed and driving profile | Can appear higher than WLTP |
The table is a schema guide, not a conversion guarantee. A vehicle designed for high-speed motorway use, a heavy SUV, and an efficient sedan won't produce the same relationship between cycles. Store the certified value exactly as published, then add a derived comparison field with the formula and assumptions recorded.
For example, if a hypothetical 75 kWh sedan is reported at 520 km WLTP, 455 km EPA, and 595 km CLTC, those are three separate observations, not competing claims about one physical distance. The record should not replace them with an averaged range. It should identify the cycle attached to each value and show the conversion only as an estimate.
The ICCT's 2025 monitor reported average ranges of 529 km in the United States, 453 km in Europe, 394 km in India, and 398 km in China, demonstrating why regional context belongs in the field model. The same report recorded approximately 4.1 million EV sales in 2025, up 33% from 2024, so specification normalization is happening alongside rapid market expansion.
Energy Efficiency and Consumption Units
Efficiency describes how much energy an EV uses to travel a distance. The cleanest database field is usually Wh/km, because it connects directly to usable battery capacity and estimated range.
Other presentations are valid:
- Wh/km: energy consumed per kilometre.
- kWh/100 km: the same measure scaled for a longer distance.
- mi/kWh: distance travelled per unit of energy, an inverse measure.
The conversions need careful handling. One kWh/100 km equals 10 Wh/km. A value in mi/kWh is converted to Wh/km by dividing the distance conversion appropriately, with 1 mi/kWh approximately corresponding to 0.621 Wh/km under the conversion specified for this dataset. In production systems, use a tested conversion function rather than hand-editing values.
| Unit | Symbol | Conversion to Wh/km | Example value | Notes |
|---|---|---|---|---|
| Watt-hours per kilometre | Wh/km | Native | 160 Wh/km | Best for range calculations |
| Kilowatt-hours per 100 km | kWh/100 km | Multiply by 10 | 16 kWh/100 km | Common European presentation |
| Miles per kilowatt-hour | mi/kWh | Apply the documented distance and inverse-energy conversion | 3.9 mi/kWh | Common U.S. presentation |
WLTP combined efficiency aggregates multiple driving phases, including low, medium, high, extra-high, and urban conditions. EPA commonly presents consumption through MPGe, using 33.705 kWh per gallon of gasoline equivalent, as described in the EV efficiency reference.
Store efficiency with its test cycle. A combined figure isn't a highway figure, and a manufacturer may publish the combined number while leaving the high-speed result elsewhere. The basic range estimate is:
estimated range km = usable battery kWh ÷ efficiency Wh/km × 1000
That result is an engineering estimate, not a measured promise. Temperature, speed, HVAC use, terrain, and battery condition belong in a separate adjustment layer so the certified efficiency value remains intact.
AC and DC Charging Specifications
“Fast charging” is too vague for a normalized EV record. Charging performance is a group of fields covering the vehicle's onboard hardware, battery architecture, connector, control communication, and observed curve.
Separate the six charging fields
- Onboard AC charger power: Store the maximum AC input in kW. A wallbox can provide more power than the car's onboard charger accepts, but it can't raise the vehicle-side AC limit.
- Supported AC phases: Record one-phase or three-phase operation, because phase support affects how an AC installation delivers its available power.
- Peak DC power: Store the maximum documented DC input in kW, clearly marked as peak rather than sustained.
- Voltage class: Keep 400 V or 800 V architecture separate from peak power. Voltage and current together determine the electrical operating envelope.
- DC connector: Use controlled values such as CCS2, CCS1, NACS, CHAdeMO, or GB/T.
- 10–80% time: Store minutes, the source's state-of-charge window, and test conditions.
The standards layer matters here. IEC 61851-1 and its charging framework covers conductive EV supply equipment and the electrical safety and control envelope, while IEC 61851-23 extends the framework to DC charging stations. The connector family should also be mapped to the relevant IEC 62196 framework rather than treated as a marketing label.
| Field | Unit | Typical range in 2025 | Connector or standard | IEC reference |
|---|---|---|---|---|
| Onboard AC power | kW | Manufacturer-specific | Type 1 or Type 2 AC inlet | IEC 61851, IEC 62196 |
| AC phase support | Phase count | One or three | Type 1 or Type 2 systems | IEC 61851 |
| Peak DC power | kW | Manufacturer-specific | CCS, NACS, CHAdeMO, or GB/T | IEC 61851-23 |
| Voltage class | V or category | 400 V or 800 V architecture | Vehicle and station compatibility | IEC 61851 |
| DC connector | Controlled text | Regional and vehicle dependent | CCS1, CCS2, NACS, CHAdeMO, GB/T | IEC 62196 |
| 10–80% duration | Minutes | Manufacturer or measured result | Depends on vehicle and charger | Test-condition field required |
Peak DC power is battery-curve-limited. A vehicle may reach its quoted maximum only in a narrow state-of-charge window, then taper as the pack fills. Analysts should therefore store peak power, curve samples, average power across a defined window, and test temperature separately. The EV charging levels guide is useful for keeping AC and DC terminology distinct.
A complete charging row should also record preconditioning status, charger output, ambient temperature, and whether the result came from an OEM test or independent measurement. Without those fields, two apparently precise charging values can describe very different sessions.
Performance Metrics and Acceleration Data
Performance records need the same discipline as range records. The core fields are peak power in kW, peak torque in Nm, 0–100 km/h time in seconds, and top speed in km/h.
Power conversions require a source convention. European brochures often use PS, with 1 PS approximately equal to 0.986 hp, while U.S. documents may distinguish SAE net from gross horsepower. Store the original published unit and a normalized kW value when the conversion basis is clear.
Record variants, not just model names
Acceleration figures are usually manufacturer-quoted results. The measurement may involve a prepared surface, launch control, a rolling start convention, and specific battery or temperature conditions. That makes a 0–100 km/h field useful for comparison, but incomplete without source type and test context.
A dual-motor or tri-motor variant deserves a separate specification row. Adding motors can change system power, torque, traction, mass, acceleration, and efficiency even when the battery pack is unchanged. Combining those variants into one row creates false precision.
A valuable derived field is power-to-weight in kW per tonne:
power_to_weight = peak system power kW ÷ kerb mass tonnes
It helps analysts compare vehicles across weight classes. Raw power may favour a heavier vehicle, while power-to-weight often gives a cleaner explanation for differences in acceleration. Keep it derived, not sourced, and retain the inputs used to calculate it.
Dimensions, Weight, and Practical Vehicle Data
A usable EV record describes more than propulsion. It needs the physical fields that determine parking fit, payload, cargo planning, towing, and energy interpretation.
Store length, width, height, wheelbase, and track width in millimetres. Use metres for turning-circle diameter and millimetres for ground clearance. Keep the original measurement convention where a source distinguishes body width, width including mirrors, or height with roof equipment.
Kerb weight describes the vehicle mass under a stated convention, commonly with a high battery state of charge and without occupants. GVWR is the maximum permitted mass with passengers, cargo, and applicable tongue load. Payload is derived as GVWR minus kerb weight, but only when both values use compatible conventions.
Practical fields that belong in the same row
- Payload capacity, with the calculation inputs retained.
- Roof load, including whether the value applies while driving or parked.
- Tow rating, separated into braked and unbraked trailer limits.
- Trailer hitch class, where documented.
- Ground clearance, with the measurement condition if suspension height changes it.
Weight also affects efficiency, but analysts shouldn't attach an unsupported universal penalty to every additional kilogram. The correct approach is to preserve the test mass used for WLTP or EPA results and distinguish it from the vehicle's listed kerb mass. That lets another analyst reproduce the calculation instead of applying a generic correction.
The same principle applies to dimensions. A manufacturer may list one body configuration while an independent test measures another wheel, tyre, or trim combination. Variant-level rows prevent those differences from contaminating range, efficiency, and packaging comparisons.
Real-World Adjustments Beyond the Brochure
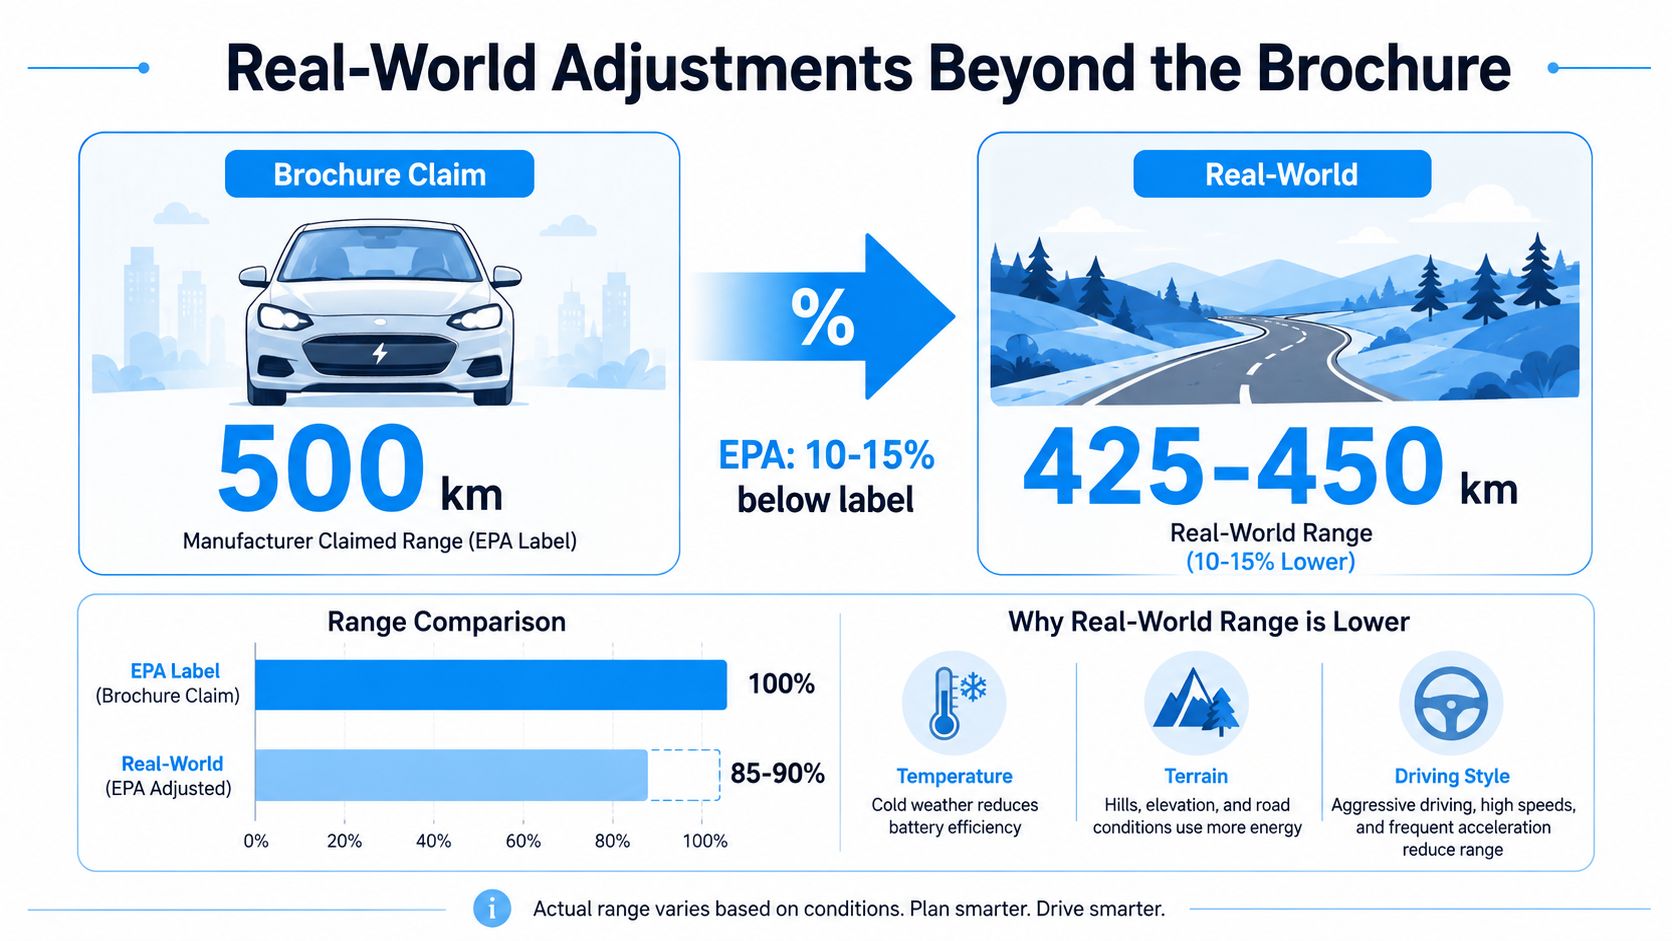
A certified range figure answers a regulatory question. It doesn't answer how far a particular EV will travel on a cold, fast motorway trip.
Recent 2026 testing summaries indicate that real-world range can fall to roughly 70–85% of WLTP, with highway results often lower than mixed-use figures, as documented in this 2026 EV real-range testing summary. Examples in that analysis include a Tesla Model 3 RWD and Hyundai Ioniq 5 with similar reported highway ranges around 300–320 km, while the Hyundai charged faster on DC. A Volkswagen ID.4 was reported around 290–310 km on the highway with slower 10–80% charging than 800 V rivals.
Store conditions, not just corrections
A useful schema adds real_world_range_km as an optional measured or estimated field, alongside:
- Temperature: Record ambient conditions and whether the battery was preconditioned.
- Speed profile: Distinguish mixed driving from highway testing and preserve the stated average or target speed.
- Climate load: Note heating, air conditioning, and other auxiliary consumption.
- Battery state of health: Identify whether the test used a new pack, an aged vehicle, or an unknown condition.
- Payload and wheels: Record occupants, luggage, tyre specification, and wheel size when available.
Don't turn a normalized brochure value into fake telemetry. Use methodology tags such as mixed_driving_23C or highway_120kmh only when those conditions are known. If the value is modelled, label it as an estimate and retain the certified result beside it.
The EPA's adjustment framework is a reminder that laboratory testing already attempts to account for real-world influences. That doesn't make every real journey predictable. It means the database should preserve both layers, official certification for regulatory comparison and condition-specific evidence for trip planning.
A Developer-Friendly Example Specification Record
A developer should be able to query an EV row without parsing prose. Every value needs an explicit unit, and every test-dependent value needs a standards block or condition field.
{
  "vehicle": {
    "brand": "Example Motors",
    "model": "Example Sedan",
    "variant": "Dual Motor",
    "market_country": "DE"
  },
  "battery": {
    "nominal_capacity_kwh": 82,
    "usable_capacity_kwh": 77,
    "chemistry": "NMC",
    "voltage_class": "800V"
  },
  "range": {
    "wltp_combined_km": 520,
    "efficiency_wltp_wh_per_km": 148,
    "real_world_range_km": null,
    "methodology": null
  },
  "charging": {
    "ac_power_kw": 11,
    "ac_phases": 3,
    "dc_peak_power_kw": 270,
    "dc_connector": "CCS2",
    "time_10_80_min": 18,
    "charging_curve": [
      {"soc_percent": 10, "power_kw": 250},
      {"soc_percent": 30, "power_kw": 270},
      {"soc_percent": 50, "power_kw": 180},
      {"soc_percent": 80, "power_kw": 90}
    ]
  },
  "performance": {
    "peak_power_kw": 239,
    "peak_torque_nm": 500,
    "zero_to_100_kmh_s": 4.8,
    "top_speed_kmh": 200
  },
  "dimensions": {
    "kerb_weight_kg": 2100,
    "length_mm": 4800,
    "width_mm": 1900,
    "height_mm": 1450,
    "wheelbase_mm": 2900
  },
  "standards_block": {
    "range_cycle": "WLTP",
    "wltp_version": "source-specific",
    "epa_test_cycle_id": null
  }
}
The values above are a schema example, not a claim about a production vehicle. In a live record, source, source_date, and measurement_conditions should accompany each test-dependent field. Percentage fields should use integers, country codes should use ISO-style strings, and SI units should remain stable throughout the API.
| Field | JSON value | Markdown cell |
|---|---|---|
| Usable battery | 77 |
77 kWh |
| WLTP range | 520 |
520 km WLTP |
| WLTP efficiency | 148 |
148 Wh/km |
| AC charging | 11 |
11 kW, three-phase |
| Peak DC charging | 270 |
270 kW, CCS2 |
| 10–80% time | 18 |
18 minutes |
| Peak power | 239 |
239 kW |
| Peak torque | 500 |
500 Nm |
| Acceleration | 4.8 |
4.8 seconds |
| Kerb weight | 2100 |
2,100 kg |
| Charging curve | Array of SOC points | Nested curve object |
This dual view catches alignment errors. If a spreadsheet cell says “270 kW” but the JSON field is time_10_80_min, the mismatch becomes visible before it reaches a comparison tool.
Charging Experience Is a System, Not a Number
Peak charging power is an attractive headline because it's easy to compare. It's also an incomplete measure of a charging session.
A better charging score combines peak kW, average power across the 10–80% window, total 10–80% minutes, and connector availability. The weighting should follow the use case. A fleet using compatible depot equipment may care about sustained power and thermal recovery, while a cross-border traveller may care more about connector coverage and reliable preconditioning.
| Vehicle | Peak kW | Average kW 10–80% | 10–80% time | Connector |
|---|---|---|---|---|
| Vehicle A | 150 | 120 | Source-specific | CCS2 |
| Vehicle B | 270 | 140 | Source-specific | CCS2 |
| Vehicle C | Source-specific | Source-specific | Source-specific | NACS |
| Vehicle D | Source-specific | Source-specific | Source-specific | GB/T |
Consider two simplified profiles. One vehicle reaches a 150 kW peak and holds 120 kW for 25 minutes. Another reaches 270 kW but tapers to 90 kW by 50% state of charge. The second vehicle's larger headline may not produce the shorter real session, because the driver experiences the area under the charging curve rather than its highest point.
The 2025 and 2026 standards discussion highlights the growing importance of connectors, inlets, accessories, 800 V systems, and high-power DC compatibility. That supports a broader conclusion: charging is a system property involving the vehicle, battery temperature, software, connector, charger, and network.
Store all four score components. A single kW field can't tell a buyer whether the car will charge quickly on the infrastructure they use.
EV Stats provides structured EV records covering range, efficiency, battery, powertrain, AC/DC charging, and performance, with comparison and charging-planning tools built around normalized fields. Visit EV Stats to compare models using the specification schema described here, then use the available charging and ownership tools to test which vehicle fits your routes and operating requirements.