

Real-world EV batteries typically lose about 1.8% to 2.3% of usable capacity per year, and a large field study found that most packs still retained more than 80% after 300,000 kilometers. Electric vehicle battery lifespan is therefore less a countdown to sudden replacement and more a gradual reduction in driving range.
That distinction changes how buyers should assess an EV. The important questions aren't just how many years the car has been driven or how many miles appear on the odometer. The better questions are how much usable capacity remains, how the vehicle was charged, whether heat affected it, and whether the remaining range still fits the owner's needs.
Table of Contents
- What Electric Vehicle Battery Lifespan Really Means
- The Two Clocks of Battery Aging
- Warranty Benchmarks and the 70% Capacity Threshold
- What Speeds Up and Slows Down Degradation
- Real-World Data From Thousands of EVs on the Road
- Replacement Costs and the TCO Bottom Line
- Putting It Together for Buyers and Fleet Managers
- Frequently Asked Questions About Battery Lifespan
What Electric Vehicle Battery Lifespan Really Means
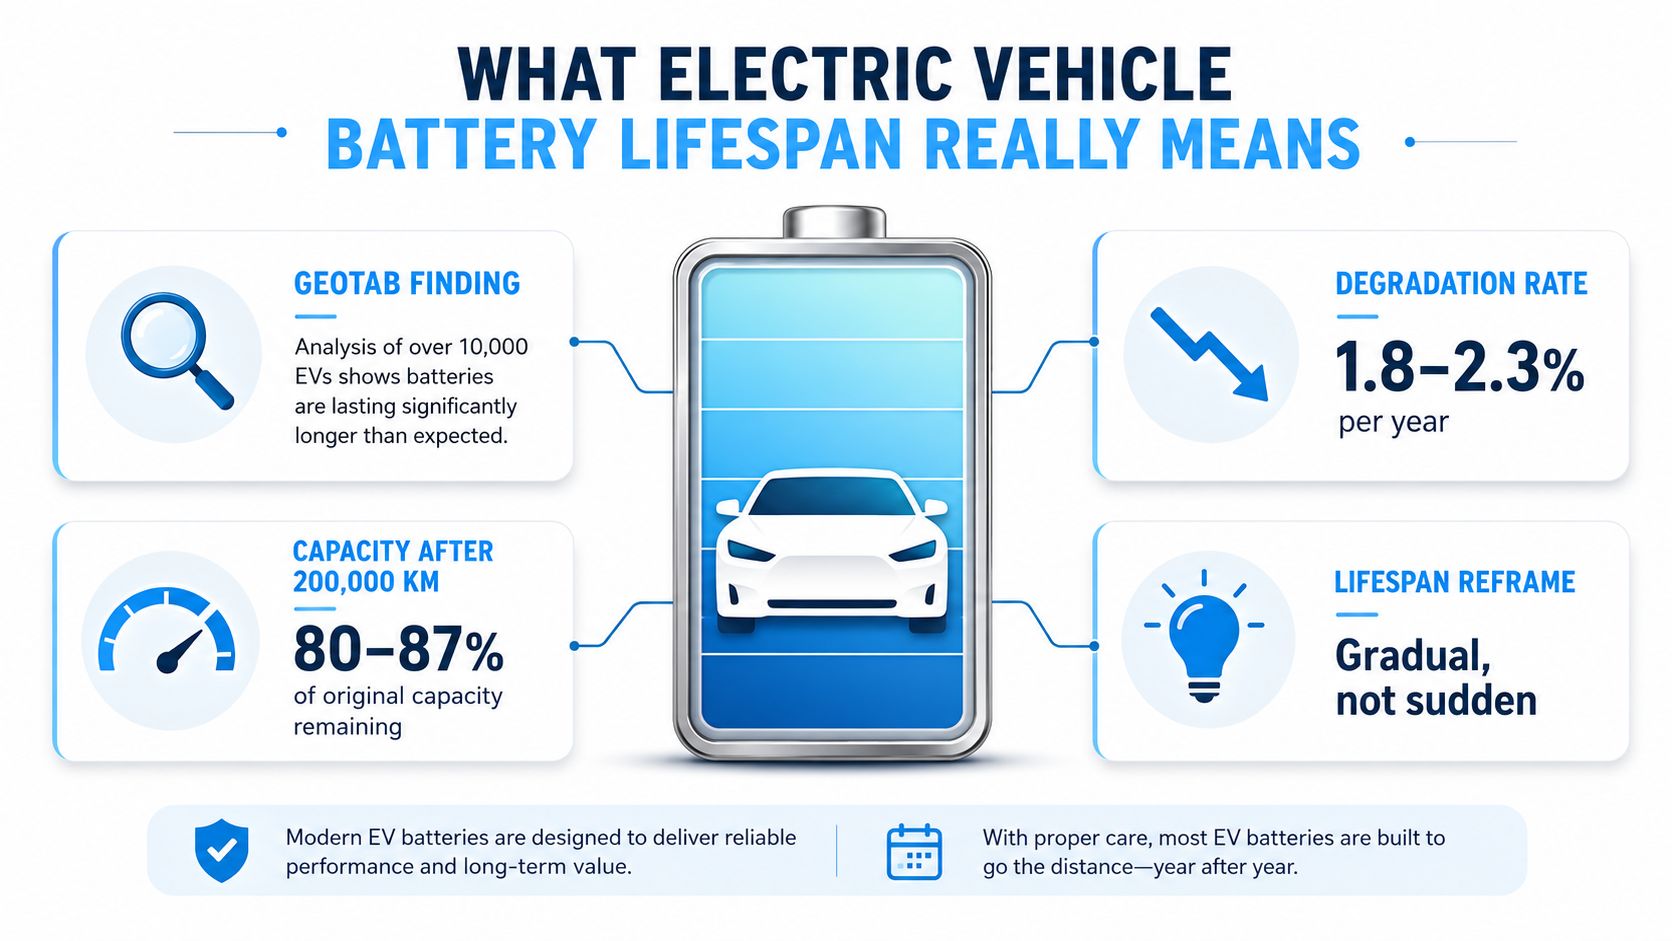
The clearest starting point is the observed degradation rate. Geotab's analysis of 22,700 electric vehicles across 21 make-models reported an average rate of 2.3% per year in its later update, compared with 1.8% per year in an earlier analysis. A separate real-world analysis of more than 7,000 EVs found that most batteries retained over 80% of their original capacity after 300,000 kilometers. These findings point to a slow loss of usable energy, not a predictable moment when every battery stops working. (Geotab's EV battery health analysis, 7,000-vehicle battery aging study)
State of Health is the useful measure
State of Health, or SoH, expresses the battery's remaining usable capacity as a percentage of its original capacity. An EV with a new usable battery capacity of 75 kWh and an SoH of 90% can store roughly 90% of that original usable energy. The dashboard may not expose this figure directly, but it matters more than age alone when estimating range, resale value, or warranty eligibility.
A battery can be old yet retain enough capacity for the driver's routine. Conversely, a relatively newer vehicle with heavy heat exposure or intensive charging may deserve closer inspection. Mileage remains useful because high utilization can increase wear, but it doesn't reveal the whole aging pattern.
Range loss is usually progressive
A simple mental model is to treat annual degradation as a gradual reduction in available range. At roughly 2% per year, a vehicle advertised with a 250-mile range would have about 230 miles under the same conditions after a decade. That's an illustrative calculation, not a prediction for every model, because chemistry, thermal management, weather, software limits, and driving conditions all shape the actual curve.
The key conclusion is practical: the battery's useful life ends when its remaining range no longer serves the owner's route, not automatically when the pack reaches a particular birthday. Geotab projects that a typical battery could retain about 81.6% of original capacity after eight years and last around 13 years or more based on observed degradation patterns. Its earlier release also stated that batteries could last 20 years or more under current trends. (Geotab battery health findings)
The Two Clocks of Battery Aging
Every lithium-ion pack ages according to two clocks. One clock advances with time, even when the vehicle is parked. The other advances as the battery supplies and receives energy during driving and charging.
Calendar aging is the time-based clock. Chemical reactions continue inside the cells while the vehicle sits in a driveway or garage. Electrolyte oxidation and growth of the solid-electrolyte interphase layer gradually reduce the amount of lithium that can move through the cell. The owner doesn't need to complete a driving cycle for this process to occur.
Cycle aging is the use-based clock. Each charge and discharge moves lithium ions between electrodes and adds to the battery's cumulative workload. Repeated use can contribute to lithium plating, particle cracking, and loss of active material, although the impact depends on temperature, charging power, depth of discharge, and battery chemistry.
A useful analogy is a fuel gauge with a calendar attached. The gauge moves when the vehicle drives, while the calendar keeps moving overnight. A lightly used weekend EV may experience a larger share of its aging from time. A rideshare or delivery vehicle puts more pressure on the cycle clock because it moves much more energy through the pack.
Practical rule: Don't judge a used EV by parked time or mileage alone. Ask how both clocks were managed.
For buyers comparing chemistries, the battery design matters too. Lithium iron phosphate, or LFP, and nickel-based chemistries have different operating characteristics and manufacturer recommendations, so a model-specific guide such as this explanation of LFP batteries can help prevent broad assumptions from being applied to the wrong pack.
These two clocks matter to warranty modeling because a manufacturer must account for both elapsed time and energy throughput. They also matter to resale projections. A low-mileage car isn't automatically low-risk if it spent long periods in stressful conditions, and a high-mileage fleet vehicle isn't automatically near replacement if its measured SoH remains strong.
Warranty Benchmarks and the 70% Capacity Threshold
The widely established U.S. benchmark for an EV battery warranty is 8 years or 100,000 miles, and many current warranties use a capacity threshold of about 70% of original usable capacity during the coverage period. This structure tells buyers something important: manufacturers designed mainstream lithium-ion packs as long-life components, not short-term consumables. (EV battery warranty benchmark)
A capacity guarantee isn't the same as a promise that the battery will fail at the end of the term. If a pack falls to the stated threshold before the time or mileage limit, the owner may qualify for repair or replacement, depending on the manufacturer's contract and diagnostic process. If the battery remains above the threshold, normal gradual loss generally doesn't create a warranty claim.
What the degradation math can and can't tell you
If a battery lost capacity at a perfectly constant 1.8% per year, a simple linear calculation would place the 70% point near year 17. At 2.3% per year, the same simplified calculation places it near year 13. Those are analytical illustrations based on average rates, not promises for a particular car. Actual packs can show an early decline followed by a flatter curve, and model, chemistry, climate, and use can shift the result. (Geotab's observed degradation rates)
That gap between the warranty period and the modeled threshold is why the warranty should be treated as a floor, not a scheduled expiration date. Many owners will sell or trade the vehicle before the pack approaches the threshold, making measured SoH and warranty transferability more relevant than the headline warranty length alone.
| Manufacturer | Warranty Period | Mileage Cap | Capacity Threshold | Notable Terms |
|---|---|---|---|---|
| Hyundai | Varies by model and market | Check the vehicle warranty booklet | Often about 70% where specified | Confirm transfer rules and exclusions |
| Kia | Varies by model and market | Check the vehicle warranty booklet | Often about 70% where specified | Confirm transfer rules and exclusions |
| Tesla | Varies by model and battery configuration | Check the vehicle warranty booklet | Often about 70% where specified | Coverage can differ by model and battery |
| Other manufacturers | Varies | Varies | Often about 70% where specified | Use the VIN-specific warranty documents |
The table is deliberately a buying prompt rather than a substitute for contract review. Warranty period, mileage cap, transfer rules, and capacity testing procedures differ by vehicle and market. A used-EV buyer should obtain the exact warranty terms for the VIN before assigning a resale or replacement value.
What Speeds Up and Slows Down Degradation
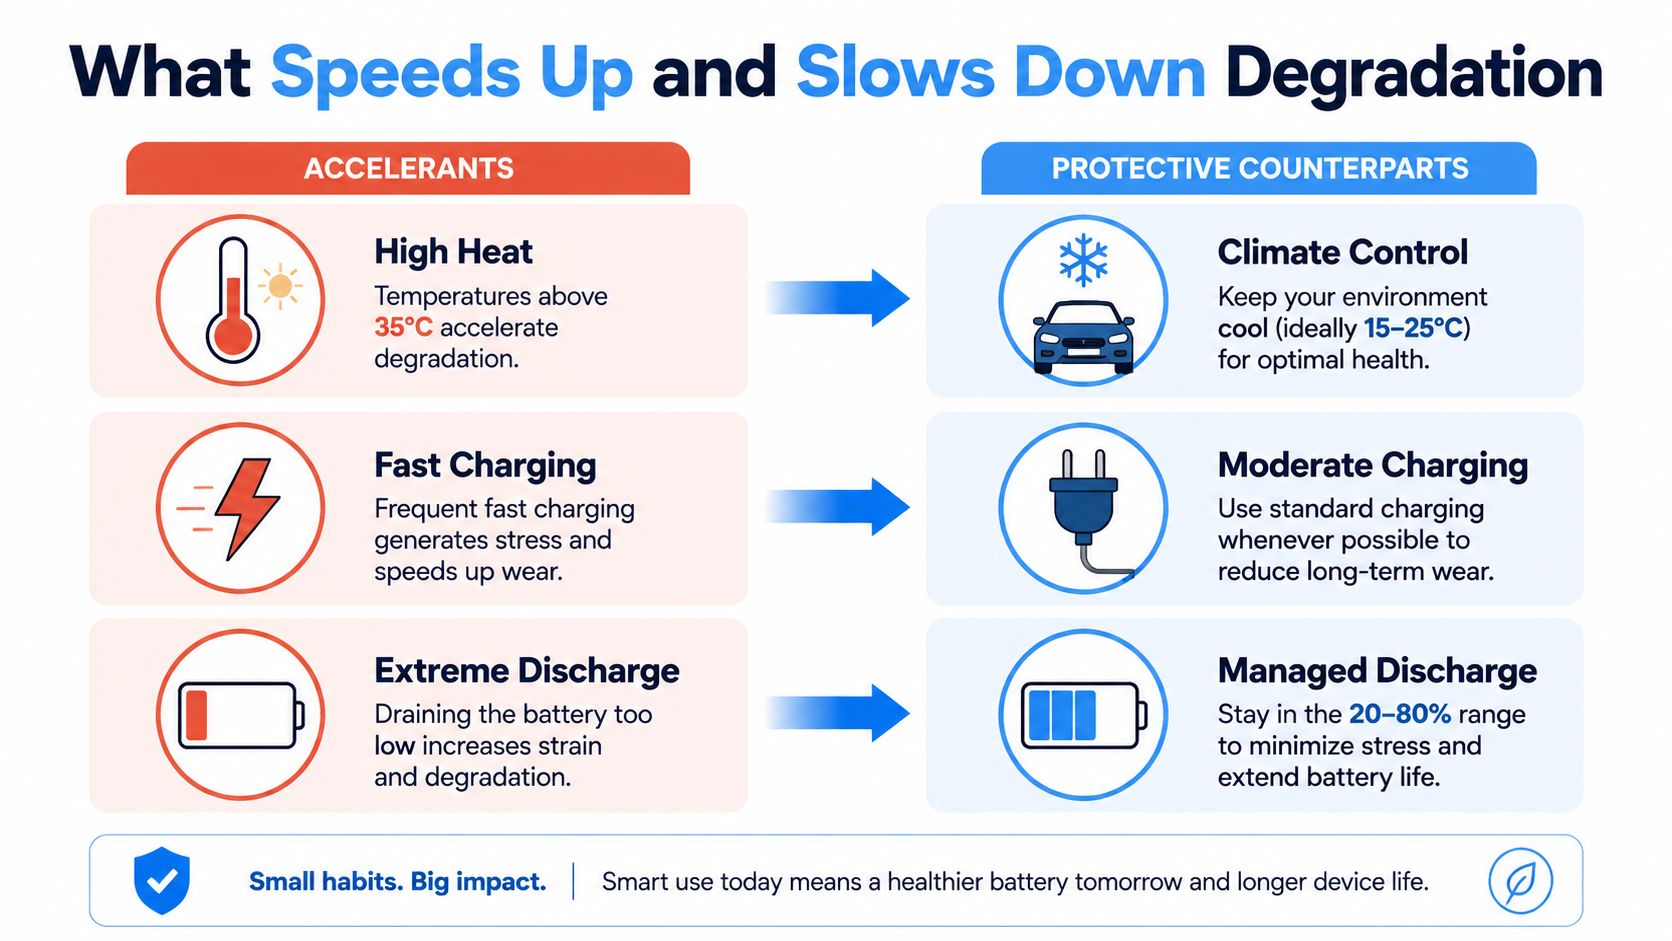
Battery aging responds most strongly to operating conditions. The approved field evidence identifies high-power DC fast charging, hot climates, prolonged extreme charge states, and high utilization as important variables, while the Stanford and SLAC research shows that fixed laboratory tests can understate real-world battery life by up to about 40% because drivers create mixed conditions rather than repeating one rigid cycle. (Stanford and SLAC battery-life research, Geotab charging and climate analysis)
Heat changes the baseline
High temperature increases chemical activity inside lithium-ion cells and can accelerate aging. Geotab reported that vehicles in hotter climates degraded 0.4% faster per year than vehicles in mild climates. Thermal management reduces the impact, but it doesn't remove climate from the ownership equation. (Geotab climate findings)
Cold weather creates a different problem. It can reduce available power and charging speed temporarily, especially during DC fast charging, even though the provided field data doesn't isolate consistently cold-only regions well enough to assign a long-term degradation rate. Buyers should separate temporary winter range reduction from permanent capacity loss.
Charging power is a fleet decision
Geotab's groups showed a clear distinction between vehicles using lower-power charging and those relying heavily on high-power DC fast charging. Vehicles in the high-frequency, high-power group were projected at 3.0% annual degradation, while the low-frequency group averaged 1.5% per year in that analysis. The study also found that high-power DC fast charging above 100 kW was the largest stressor in its dataset. (Geotab charging-power findings)
For a private driver, occasional fast charging is a convenience choice. For a fleet manager, it becomes an infrastructure policy. Overnight AC charging is usually the sensible default when schedules allow, while high-power DC charging should be reserved for routes that need it.
Charge windows need context
Geotab found that moderate exposure to extreme state-of-charge levels had little measurable effect, while degradation accelerated when vehicles spent over 80% of their total time at or near extreme charge levels. That is more nuanced than treating every charge to 100% as harmful. (Geotab state-of-charge findings)
The practical ranking is climate first, charging power next, and charge-state habits after that, although the exact order can vary by vehicle and duty cycle. Use the manufacturer's charge guidance, avoid leaving a vehicle parked for long periods near full or empty, and don't sacrifice operational reliability to follow a rigid rule that the field data doesn't support.
For a deeper explanation of how these variables interact, see EV battery degradation analysis.
Real-World Data From Thousands of EVs on the Road
Annual capacity loss gives a more useful ownership baseline than a replacement countdown. Geotab's analysis of 22,700 EVs reported average degradation between 1.8% and 2.3% per year across successive analyses. Separately, the 7,000-plus-vehicle analysis found that most batteries retained over 80% of their original capacity after 300,000 kilometers. These are cohort averages, not guarantees for every vehicle, but they describe normal field performance more accurately than a single worst-case test. (Geotab EV dataset, 7,000-vehicle study)
Why laboratory results can look worse
Stanford and SLAC researchers reported that conventional laboratory lifetime tests can understate EV battery life by up to about 40%. Fixed-cycle testing may not reproduce the varied sequence of traffic, highway travel, short trips, parking, rest, and intermittent charging that shapes real-world use. (Stanford and SLAC research)
Controlled testing still has a clear purpose. It isolates chemistry and stress mechanisms. The analytical error is treating that result as a direct forecast for every privately owned car, rather than separating controlled evidence from actual duty cycles.
| Source / Study | Vehicles Tracked | Avg Annual Degradation | Capacity at 200,000 km | Year-Over-Year Trend |
|---|---|---|---|---|
| Geotab earlier analysis | Large EV cohort | 2.3% | Not specified in the verified data | Earlier benchmark |
| Geotab later analysis | 22,700 EVs across 21 make-models | 2.3% | Not specified in the verified data | Later update returned to the earlier average |
| Geotab earlier improvement analysis | EV cohort across common models | 1.8% | Not specified in the verified data | Improved average in the earlier cohort |
| Real-world battery aging study | More than 7,000 EVs | Not specified in the verified data | Most retained over 80% after 300,000 km | Newer EVs may be degrading more slowly |
The table's main lesson is interpretive. A later 2.3% average does not show that battery design regressed. Vehicle mix, chemistry, charging behavior, and use patterns can shift the result. Newer packs may perform better under some conditions, while a larger or differently used sample produces another average.
For resale, gradual degradation changes the calculation. A buyer who assumes a battery is approaching replacement at a pessimistic laboratory milestone may discount a healthy vehicle too heavily. For fleet managers, measured SoH and charging history are more useful risk indicators than a generic retirement date. Annual capacity loss should shape range and resale assumptions, while warranty terms and vehicle condition determine how much replacement exposure belongs in the cost model.
Replacement Costs and the TCO Bottom Line
Geotab's observed degradation supports a gradual-loss model: a typical battery reached 81.6% capacity after eight years, with projected service life of around 13 years or more. That evidence changes the TCO question. Owners are not automatically facing a replacement bill at the end of the warranty period. They are managing annual capacity loss, warranty coverage, resale value, and the smaller possibility of a repair or replacement event.
A high replacement quote still matters, but it should not become a universal cost assumption. The available evidence does not establish a reliable current price range, failure probability, per-mile reserve, or internal-combustion maintenance comparison. Those figures should be calculated for a specific vehicle and use case, not presented as fixed EV ownership costs.
Model the risk instead of assuming failure
A useful TCO model separates replacement exposure from normal battery aging. Build three battery-related lines into the calculation:
- Capacity loss: Estimate the range reduction expected from the vehicle's climate, mileage, and charging pattern. The financial effect appears when reduced range changes daily usability, charging time, or resale value.
- Warranty protection: Record the remaining time, mileage, SoH threshold, and transfer conditions. These terms define which battery risks the owner does not carry.
- Post-warranty exposure: Check whether the manufacturer supports module-level repair, pack-level replacement, or diagnostic testing for that model.
This structure avoids assigning the entire theoretical pack price to every EV owner, which treats a potential event like routine maintenance. Field evidence indicates that many packs remain usable beyond the standard warranty period. For a detailed breakdown of running costs, see our analysis of electric car running costs.
Analyst's view: Put battery replacement in the sensitivity analysis, not automatically in the base case.
Fleet reserves should reflect duty cycle. A high-mileage operation that relies heavily on high-power DC charging needs a different assumption from vehicles charged mostly overnight. An individual buyer may get more decision value from a battery-health report, warranty coverage, and expected holding period than from an alarming headline price for a complete pack.
Range also has an economic value. If an older EV still covers the owner's daily route, declining SoH may have little immediate financial effect. If capacity loss adds charging stops, slows journeys, or brings forward vehicle replacement, it becomes a real ownership cost even without a battery invoice. That distinction keeps TCO tied to use rather than to a theoretical failure date.
Putting It Together for Buyers and Fleet Managers
The purchase decision becomes clearer when the battery is evaluated across the owner's holding period rather than as a single lifespan number.
Under five years
For a short ownership horizon, focus on residual capacity and warranty transferability. The buyer of a new EV should preserve documentation showing how the battery is covered. A used-EV buyer should ask for a diagnostic report or manufacturer health reading, then compare the measured SoH with the vehicle's expected range in the climate where it will operate.
Five to ten years
This is the period when resale assumptions deserve scrutiny. The battery may still have substantial usable capacity, but buyers will care about remaining warranty mileage, fast-charging history, climate exposure, and whether the model has a reputation for accessible diagnostics. A vehicle with a healthy pack and a transferable warranty can be easier to value than one with similar mileage but no documentation.
Beyond the warranty
Once coverage expires, the question changes from “Will it fail?” to “What range and repair options remain acceptable?” Geotab's observed degradation patterns support a longer-life interpretation, including a projection of about 13 years or more for a typical battery, but averages can't remove model-specific risk. (Geotab battery lifespan projection)
A fleet manager should apply the same logic at vehicle level. Group vehicles by charging behavior, climate, utilization, and measured SoH rather than retiring every unit at the same odometer reading. High use may be economically rational if the vehicle generates enough productivity, while a lightly used unit with poor storage practices may need a different intervention.
Use this checklist before buying or approving a vehicle:
- Request pack health evidence. Look for SoH, usable capacity, diagnostic results, or a manufacturer report.
- Review charging history. Frequent high-power DC fast charging deserves closer analysis than occasional road-trip use.
- Assess climate exposure. Heat can shift the expected degradation curve.
- Confirm warranty details. Check time, mileage, capacity threshold, exclusions, and transferability.
- Match remaining range to the mission. A battery can remain serviceable even after losing capacity if the route still fits.
The conclusion is counterintuitive but useful: a battery with lower SoH isn't automatically a bad purchase, and a newer battery isn't automatically low-risk. The financially relevant combination is remaining capacity, expected use, coverage, and the cost of replacing the vehicle if range no longer works.
Frequently Asked Questions About Battery Lifespan
How far can an EV travel before the battery reaches 70% capacity?
There is no universal mileage threshold. Chemistry, climate, charging power, and duty cycle all affect degradation. A real-world analysis of more than 7,000 EVs found that most batteries retained over 80% after 300,000 kilometers. Geotab's observed annual averages ranged from 1.8% to 2.3%. Many vehicles may therefore remain above 70% well beyond the usual warranty period, although individual packs can differ. (7,000-vehicle study, Geotab degradation data)
How can I verify the health of a used-EV battery?
Request a manufacturer battery-health report when available. If none exists, arrange a qualified diagnostic inspection. A technician may assess the pack through vehicle diagnostics, including compatible OBD-based tools. The result should identify usable capacity or SoH, not merely confirm that the car operates. Compare it with the remaining warranty and the range required for regular trips.
Does DC fast charging shorten battery life?
Frequent high-power DC fast charging can increase degradation, especially when it is the vehicle's normal charging method. Geotab identified high-power DC fast charging above 100 kW as a major stressor. Its highest degradation group recorded 3.0% per year, compared with 1.5% per year for the low-frequency group. Occasional fast charging remains practical. The effect depends on frequency, power, temperature, and thermal management. (Geotab DC fast-charging findings)
What does an out-of-warranty replacement cost?
A reliable universal cost band is not available from the verified data. Pricing varies with battery size, chemistry, model, labor, parts availability, and repair strategy. A module fault may require a different response from a complete-pack failure. Treat any full-pack quote as a model-specific scenario, then ask whether qualified repairers can diagnose or replace individual components.
For a purchase decision, capacity loss is more useful than a replacement countdown. Obtain pack-health evidence, review charging and climate history, read the exact warranty, and test whether remaining range supports the planned ownership period. That approach connects annual degradation with warranty coverage, resale risk, and total cost of ownership.
EV Stats helps compare EV battery capacity, range, efficiency, charging performance, and ownership-cost assumptions across a structured catalog. Visit EV Stats to shortlist models, test charging scenarios, and evaluate battery-related TCO decisions with comparable data.