

Most advice about electric car running costs starts and ends with one comparison: electricity is cheaper than petrol, so an EV must be cheaper overall. That conclusion is often directionally right for home charging, but it's incomplete. The result depends on the entire ownership cost stack, including energy, servicing, tires, insurance, depreciation, financing, taxes, and access to affordable charging.
A useful comparison therefore asks a harder question: which cost lines are lower for the EV, which are higher, and how does the driver use the car? The answer can change sharply between a homeowner charging overnight and a driver dependent on public rapid chargers. It can also change between a long-term owner and someone replacing a new vehicle after a short cycle.
Table of Contents
- Why Running Costs Are Not Just About Charging
- The Building Blocks of an EV Cost Model
- Energy Costs at Home and on Public Networks
- Maintenance, Tires, and Insurance
- Depreciation and the Hidden Cost of a New EV
- Worked Example Comparing an EV and a Petrol Car
- Personalizing the Estimate Before You Buy
Why Running Costs Are Not Just About Charging
Charging is the most visible EV saving because drivers can compare a home electricity bill with a petrol receipt. In the UK, government guidance says a medium-sized electric car charged at home costs about 8p per mile, compared with 13p to 17p per mile for an equivalent petrol or diesel car as of January 2024. The same guidance cites independent research indicating average annual savings of about £700, while warning that public-network charging is, on average, roughly equivalent to fuelling a comparable petrol car. These figures come from the International Energy Agency electric-vehicle total-cost-of-ownership tool.
That distinction matters. A driver who charges mainly at home captures the strongest energy advantage. A driver who uses public charging for most journeys may retain an efficiency benefit, but the charging price can remove much of the cash saving. Neither result says anything yet about insurance, tires, depreciation, or financing.
The cost stack behind the headline
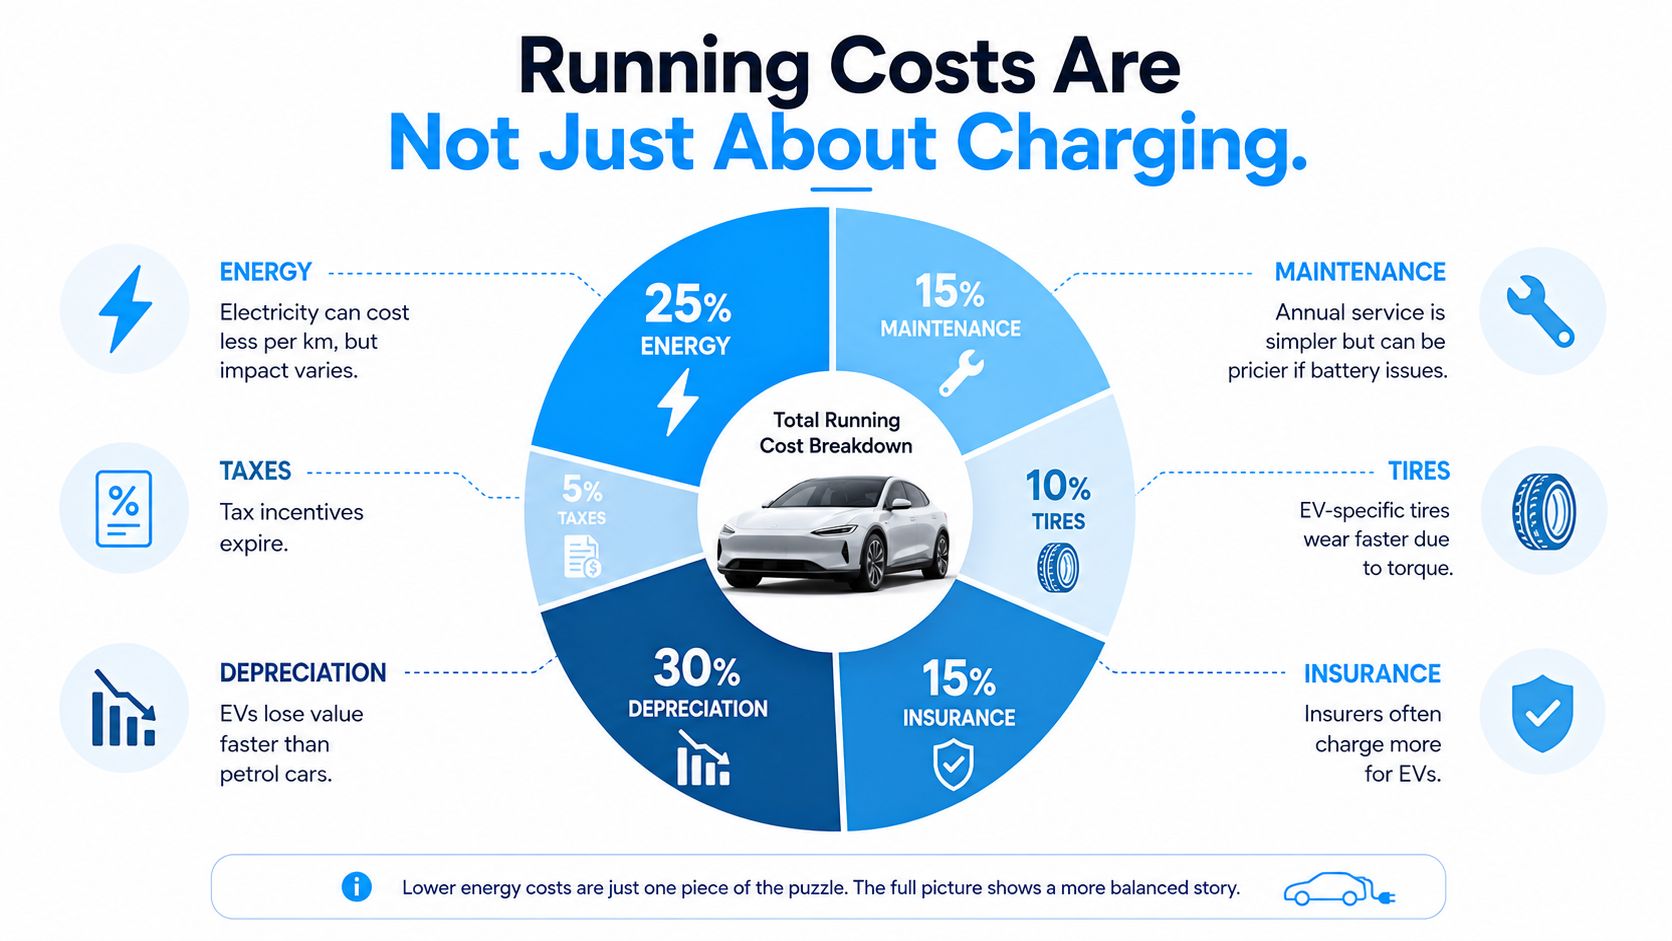
An analyst's model separates costs into lines rather than treating “fuel” as a proxy for everything:
- Energy: Electricity for the EV, or petrol and diesel for the ICE baseline.
- Maintenance and repairs: Routine servicing, consumables, mechanical repairs, and battery-related work.
- Tires: A semi-variable wear cost influenced by vehicle mass, torque, alignment, driving style, and tire specification.
- Insurance: A recurring ownership cost shaped by repair complexity, vehicle value, battery exposure, and local pricing.
- Depreciation: The purchase price less the vehicle's resale value over the holding period.
- Taxes and fees: Registration charges, road taxes, financing costs, and other fixed or distance-linked obligations.
The most important insight is that low energy cost doesn't guarantee low total ownership cost. A 2025 US analysis found that all 54 EVs in its comparison had lower fuelling costs than comparable gasoline vehicles, and 43 of 54 had lower maintenance costs, yet only 24 of 54 had lower five-year ownership costs overall. The analysis explicitly included depreciation, fees and taxes, financing, insurance, fuel, maintenance, and repairs. Its 2025 EV analysis explains why the answer can turn on non-fuel lines.
Practical rule: Treat charging as one input to the ownership calculation, not as the verdict.
The Building Blocks of an EV Cost Model
A reliable TCO model begins by defining the period and the baseline. Compare an EV with a comparable ICE vehicle, use the same holding period, and apply the same annual mileage. Otherwise, the cheaper vehicle may be receiving more favourable assumptions.
The basic formula is:
Total cost of ownership = purchase price + financing + energy + maintenance + repairs + tires + insurance + taxes and fees − resale value.
For a running-cost-only view, exclude the purchase price and financing only when both vehicles are already owned or when the comparison deliberately focuses on usage. For a buying decision, include them. Depreciation is not an abstract loss. It's the portion of the purchase price that the owner doesn't recover at sale.
Separate fixed, semi-variable, and variable costs
Fixed costs arrive whether the car moves or not. Insurance, finance charges, registration costs, and the ownership portion of depreciation belong here. Variable costs rise directly with mileage, including electricity, petrol, tire wear, and some maintenance. Semi-variable costs sit between the two. A service visit may be scheduled by time or mileage, while insurance can change with the model, driver, location, and repair exposure.
| Cost Line | What It Covers | Type |
|---|---|---|
| Energy or fuel | Home, workplace, and public electricity, or petrol and diesel | Variable |
| Maintenance | Scheduled service, fluids, inspections, and brake-related work | Semi-variable |
| Repairs | Mechanical, electrical, software, and battery-related repairs | Semi-variable |
| Tires | Replacement tires, fitting, alignment, and wear | Variable |
| Insurance | Annual cover and model-specific risk pricing | Fixed |
| Depreciation | Purchase price minus resale value | Fixed over the holding period |
| Taxes and fees | Road charges, registration, and other ownership costs | Fixed or semi-variable |
| Financing | Interest and arrangement costs | Fixed |
Convert every line into a common unit. Divide annual costs by annual miles for pence per mile, or by kilometres for a metric comparison. For energy, multiply the vehicle's consumption in kWh per mile by the electricity price per kWh. For an ICE car, divide the fuel price per gallon by miles per gallon, then convert the result into the same currency and distance unit.
The assumptions deserve their own page in a spreadsheet. Record annual mileage, charging mix, tariff, fuel price, service schedule, tire replacement timing, insurance quotes, holding period, purchase price, and expected resale value. A transparent model is more useful than a confident headline because you can change each assumption and see what moves the result.
Energy Costs at Home and on Public Networks
Home charging usually creates the clearest EV advantage, but the relevant question isn't the price of a full battery. It's the price of usable energy per mile, after considering the vehicle's efficiency and the charging source.
The UK government's comparison puts home charging for a medium-sized EV at about 8p per mile, versus 13p to 17p per mile for equivalent petrol or diesel use as of January 2024. That comparison supports the familiar conclusion, but it also contains an important qualification: public-network charging is, on average, roughly equivalent to fuelling an equivalent petrol car. Drivers should therefore model their actual charging mix rather than label every electric mile as cheap.
For a practical tariff and vehicle-specific calculation, use the EV charging cost guide as a starting point, then replace generic assumptions with your own electricity rate and measured consumption. A vehicle that charges mostly at home has a different energy profile from one that depends on rapid charging during working days.
Cold weather changes the unit cost
Temperature affects the economics through two linked mechanisms. The car needs more energy for cabin and battery heating, and charging efficiency can worsen. AAA reported that at 20°F, EV operating costs rose by $32.11 per 1,000 miles for home charging and by $76.93 per 1,000 miles when using public charging, compared with warmer conditions. The same AAA winter EV analysis reported significant declines in range and efficiency at the colder temperature.
| Charging Source | Typical p/kWh | Winter Efficiency Penalty | p/Mile, Mid-size EV |
|---|---|---|---|
| Home charging | Depends on tariff | Higher energy demand and charging losses | Model using household rate |
| Workplace or destination charging | Depends on provider | Depends on exposure and session timing | Model using provider rate |
| Public rapid charging | Often carries a convenience premium | Larger cash impact when efficiency falls | Model using session price |
| Public ultra-rapid charging | Usually the highest convenience price | Winter penalty compounds the tariff premium | Model using actual network price |
The table deliberately avoids pretending that one tariff represents every driver. Public charging can include membership prices, demand charges, session fees, and idle fees. Home charging can require installation expenditure and may be unavailable to renters or drivers without off-street parking. Access is therefore an economic variable, not merely a convenience feature.
In the United States, the cost advantage can be substantial when electricity prices and vehicle use align. A 2018 analysis reported gasoline cars cost 2.3 times as much to run as electric cars nationwide, with the ratio ranging from 1.4 in Hawaii to 3.6 in Washington state. A 2022 analysis found EVs were three to five times cheaper per mile than gasoline cars in the US, with certain EVs in some states reaching five to six times cheaper per mile. Its example compared $12.54 to charge a Tesla Model 3 Standard Range with $70.55 to fill a Honda Civic, equal to $0.05 per mile versus $0.17 per mile. Those figures are from the Coltura EV savings report, and they show why location belongs in every serious model.
Maintenance, Tires, and Insurance
The EV drivetrain removes several familiar service tasks, but it doesn't remove wear. Battery-electric vehicles have fewer moving drivetrain components, no engine oil changes, and can use regenerative braking to reduce friction-brake demand. That creates a genuine maintenance advantage against an ICE car, although the saving appears over the service and repair cycle rather than at every workshop visit.
Consumer Reports found that BEV and PHEV drivers save about 50% on repair and maintenance costs, equal to roughly $4,600 less over a typical vehicle lifetime than ICE models. The Consumer Reports ownership-cost analysis supports the structural conclusion: an EV can spend less on routine mechanical upkeep, but the owner still needs to budget for tires, inspections, suspension components, body repairs, and electrical systems.
Tires can absorb part of the saving
Tire wear deserves separate treatment because it tracks both vehicle mass and driver behaviour. Higher torque can make aggressive acceleration expensive in a way that doesn't appear on an electricity tariff, while heavier vehicles can place more load on each tire. A North American TCO analysis noted that EVs may need tire changes every 20,000 to 40,000 miles because of heavier drivetrains and higher torque. That range is cited in the same Consumer Reports report, which is the most relevant source for this maintenance and wear discussion.
Insurance belongs in the same middle layer because it isn't a per-mile energy cost, but it can materially alter the annual bill. Insurers price the vehicle, repair exposure, battery systems, parts availability, driver profile, location, and claims history. A premium EV trim can carry a different insurance quote from a lower-powered version of the same model, so a generic “EV insurance” assumption is too blunt.
| Cost Line | EV, per year | Petrol, per year | Delta |
|---|---|---|---|
| Scheduled maintenance | Model from the manufacturer schedule | Model from the manufacturer schedule | Often lower for the EV |
| Repairs | Include electrical and battery-related exposure | Include engine, transmission, exhaust, and fuel-system exposure | Model by warranty and age |
| Tires | Use the specific tire size and observed wear | Use the equivalent vehicle's specification | May narrow the EV advantage |
| Insurance | Obtain model-specific quotes | Obtain equivalent model quotes | Can favour either vehicle |
Avoid assigning unsupported generic annual amounts to this table. The defensible method is to collect quotes and service schedules for the exact cars under consideration. A low energy bill is valuable, but it can be partly absorbed by tire replacement and insurance before depreciation enters the calculation.
Depreciation and the Hidden Cost of a New EV
Depreciation is often the largest ignored line in an optimistic EV comparison. An owner who buys a new car for one price and sells it later for less has incurred a real cost, even if no invoice arrives each month. Divide that loss by the months or miles of ownership and it becomes an effective running cost.
EV residual values can face particular uncertainty when manufacturers refresh models quickly, improve battery technology, change pricing, or introduce new charging capability. Used buyers may also weigh battery health, warranty coverage, repair availability, and access to charging. These factors don't affect every model equally, so applying one depreciation percentage to every EV creates a false sense of precision.
Choose where to carry the resale risk
The depreciation decision is partly a purchase decision and partly a financing decision.
- Buying new: You control the specification and warranty position, but you carry the full exposure to early resale-value changes.
- Buying used: Another owner has already absorbed some of the steepest value loss, although battery condition and warranty terms need close inspection.
- Leasing: The finance provider carries the residual-value risk, but the lease payment reflects its estimate and may include a risk premium.
- Holding longer: A longer ownership period can spread the initial loss across more miles, provided repair and battery-risk assumptions remain acceptable.
A vehicle's advertised efficiency won't tell you whether its depreciation is manageable. Compare the likely resale value with the equivalent petrol car, then divide the difference by the expected ownership miles. The result should sit beside energy, tires, insurance, and maintenance in the same model.
For buyers screening the market, the best-value electric car comparison can help narrow the shortlist before you obtain finance and insurance quotes. It shouldn't replace those quotes, because value depends on the buyer's mileage, charging access, and holding period.
A short ownership cycle makes depreciation more influential because the owner has fewer miles over which to spread the initial loss. A long-term owner may reduce its effect on cost per mile, but shouldn't assume the result automatically favours the EV. Battery warranty, repair exposure, tire consumption, and resale demand still need to be tested against the ICE alternative.
Worked Example Comparing an EV and a Petrol Car
A worked example is useful only if every input is visible. The verified evidence supports a directional comparison, but it doesn't provide one consistent vehicle pair with purchase prices, insurance premiums, tire bills, service costs, and three-year resale values. Those inputs would have to be invented to produce a numerical three-year verdict, so the responsible approach is to show the calculation architecture and identify the break-even condition.
Use three columns: an EV charged at home, the same EV charged through public networks, and a comparable petrol car. Keep the purchase price, holding period, annual mileage, and insurance basis consistent where the vehicles are comparable.
| Cost Line | EV Home Charging | EV Public Charging | Petrol |
|---|---|---|---|
| Purchase price | Exact transaction price | Exact transaction price | Exact transaction price |
| Energy or fuel | Electricity consumption × home tariff × miles | Electricity consumption × public tariff × miles | Fuel consumption × petrol price × miles |
| Maintenance | Manufacturer schedule and repair reserve | Same vehicle assumption | Petrol service schedule and repair reserve |
| Tires | Model-specific tire price and replacement timing | Same vehicle assumption | Equivalent tire price and replacement timing |
| Insurance | Quote for exact EV trim | Same vehicle assumption | Quote for exact petrol trim |
| Taxes and fees | Applicable local charges | Same vehicle assumption | Applicable local charges |
| Depreciation | Purchase price − three-year resale value | Same vehicle assumption | Purchase price − three-year resale value |
| Total | Sum of all lines | Sum of all lines | Sum of all lines |
The energy line is where the scenarios diverge. In the UK evidence, home charging for a medium-sized EV is about 8p per mile, while equivalent petrol or diesel use is 13p to 17p per mile as of January 2024. Public charging is described as, on average, roughly equivalent to fuelling an equivalent petrol car. That means the public-charged EV shouldn't be awarded the home-charging saving by default.
The break-even equation
Let:
- M equal total miles over three years.
- Eₕ equal EV home-charging cost per mile.
- Eₚ equal EV public-charging cost per mile.
- F equal petrol cost per mile.
- Dₑ and Dₚ equal EV and petrol depreciation.
- Nₑ and Nₚ equal maintenance, repair, tire, insurance, tax, and finance totals.
Then:
EV home advantage = M × (F − Eₕ) + (Dₚ − Dₑ) + (Nₚ − Nₑ).
For public charging, replace Eₕ with Eₚ. The EV wins when the relevant advantage is positive. If depreciation and fixed costs favour the petrol car, the EV must generate enough energy and maintenance savings to cover that gap. If the driver can't charge at home and uses expensive rapid charging frequently, the required mileage rises, and the EV may not beat the baseline within the planned holding period.
This is the decision rule, not “EVs are cheaper.” Calculate the fixed-cost gap first, then determine whether real charging access and annual mileage can close it.
Personalizing the Estimate Before You Buy
Generic EV running costs are useful for screening, not for signing a finance agreement. Before buying, rebuild the comparison around the exact vehicle, tariff, driver, and ownership plan. The strongest model is usually less polished than a marketing chart, but it exposes every assumption.
Start with the variables that change the energy line:
- Annual mileage: Use your actual commuting, family, business, and leisure journeys, not an optimistic estimate.
- Home-charging share: Record the proportion of miles charged at home, at work, and on public networks.
- Tariff mix: Separate standard-rate electricity from any cheaper overnight or time-of-use charging.
- Rapid-charging frequency: Count motorway and ultra-rapid sessions separately because convenience pricing can alter the result.
- Winter use: Adjust the model if cold-weather driving is a meaningful part of your annual mileage.
The next group determines whether the EV's mechanical advantage survives contact with ownership. Obtain the manufacturer's service schedule, price the exact tire size, and ask how replacement timing changes with vehicle weight and driving style. Then request insurance quotes for the precise trim and battery configuration rather than using a class-wide average.
Test the assumptions that flip the result
Depreciation deserves a scenario range rather than a single confident input. Model the expected resale value at the end of your planned holding period, then test a weaker outcome and a stronger outcome. Do the same for public charging share, because a comparison based on 100% home charging is irrelevant if you live in a flat without dedicated parking.
Use a vehicle cost calculator for electric cars to organize the inputs, but verify its assumptions against your own bills, quotes, and mileage records. The tool can structure the calculation, while only your actual use can determine whether the result reflects your life.
A useful estimate isn't the one with the most decimal places. It's the one you can audit and rebuild.
Before committing, run at least three cases:
- Expected case: Your realistic charging mix, normal tire replacement, current insurance quotes, and a defensible resale estimate.
- Public-charging case: A higher share of public and rapid charging, with the associated tariff and winter exposure.
- Resale-risk case: A weaker end value, especially if you're buying new and planning a short holding period.
The conclusion should identify the condition under which the EV wins. That might be reliable home charging, high annual mileage, long ownership, or a model with competitive insurance and resale prospects. If those conditions aren't present, a petrol car or a used EV may produce the lower total cost, even when the EV has the cheaper energy line.
EV Stats brings manufacturer specifications and independent test context into a structured EV database, with model comparisons, charging information, ownership-cost estimates, and tools for testing different usage assumptions. Visit EV Stats to compare candidate vehicles and model electric car running costs before you buy.